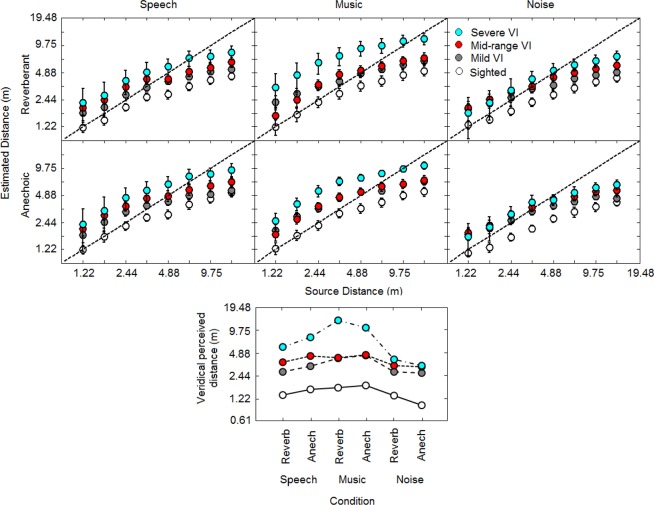
Figure 3.
Judged auditory distance plotted as a function of virtual sound source distance (top panels), and veridical perceived distances (distances at which the perceived distance most accurately matched the simulated distance) for each condition (bottom panel). In the top panels, geometric mean estimates are indicated by open (sighted participants), and closed grey (mild VI), red (mid-range VI), and blue (severe VI) symbols. The left, middle and right panels show results for speech, music and noise stimuli, respectively. The upper and lower panels show results for the reverberant and anechoic rooms, respectively. Perfect performance is indicated by the dashed lines. Error bars represent ±1 standard error across participants, and are not shown when smaller than the symbol size. The lower panel shows veridical perceived distances in each condition for each group; values were obtained from the intercept between lines of best fit for each condition (not shown) and the line for perfect performance in the top panels.

