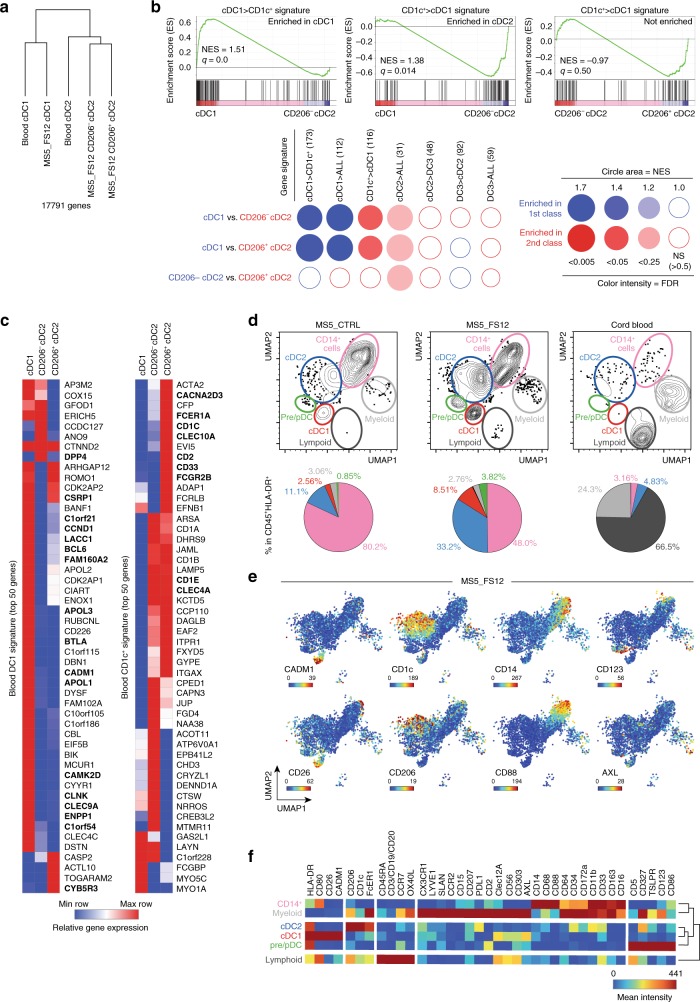
Fig. 4. Human DC generated in vitro align with circulating blood DC.
a Hierarchical clustering of primary (n = 3 healthy donors) vs. in vitro-generated (n = 3 cord blood donors) cDCs based on 17,791 genes after removing the “in vitro culture signature” (2000 genes) defined by pairwise comparison of primary versus in vitro generated subsets. b GSEA using blood cDC1s (DC1>CD1c+) and CD1c+ cells (CD1c+>DC1) signatures generated from published datasets60, as well as previously published signatures of blood cDC1 (DC1>ALL), cDC2 (DC2>ALL), and cDC3 (DC3>ALL)20. BubbleMap shows the enrichment of each gene signature in the pairwise comparison of CD141+Clec9A+, CD1c+CD206−, and CD1c+CD206+ cells generated in vitro (FDR false detection rate, NES normalized enrichment score). For single pairwise comparisons (top), statistical significance is defined by the FDR q-value calculated by the GSEA software (www.broad.mit.edu/gsea) using default parameters. For multiple pairwise comparisons (bottom), the statistical significance was further corrected for multiple testing by the BubbleMap module of BubbleGUM software. c Heatmaps of RNA-seq data displaying the expression of the top 50 genes of blood cDC1 and CD1c+ cells signatures in CD141+Clec9A+, CD1c+CD206−, and CD1c+CD206+ cells generated in vitro. Genes shared with previously published signatures20 are highlighted in bold. d UMAP (Uniform Manifold Approximation and Projection) plots of CyTOF data from CD45+HLA-DR+ cells differentiated in vitro using MS5_FS12 and MS5_CTRL as compared with cord blood PBMCs. Pie charts indicate the frequency of each subset among the CD45+HLA-DR+ cells (mean of n = 2 cord blood donors in two independent experiments). e Relative expression of selected markers in UMAP plots of CyTOF data from cells differentiated in vitro with MS5_FS12. f Heatmap of markers mean intensity in each subset identified in MS5_FS12 cultures.

