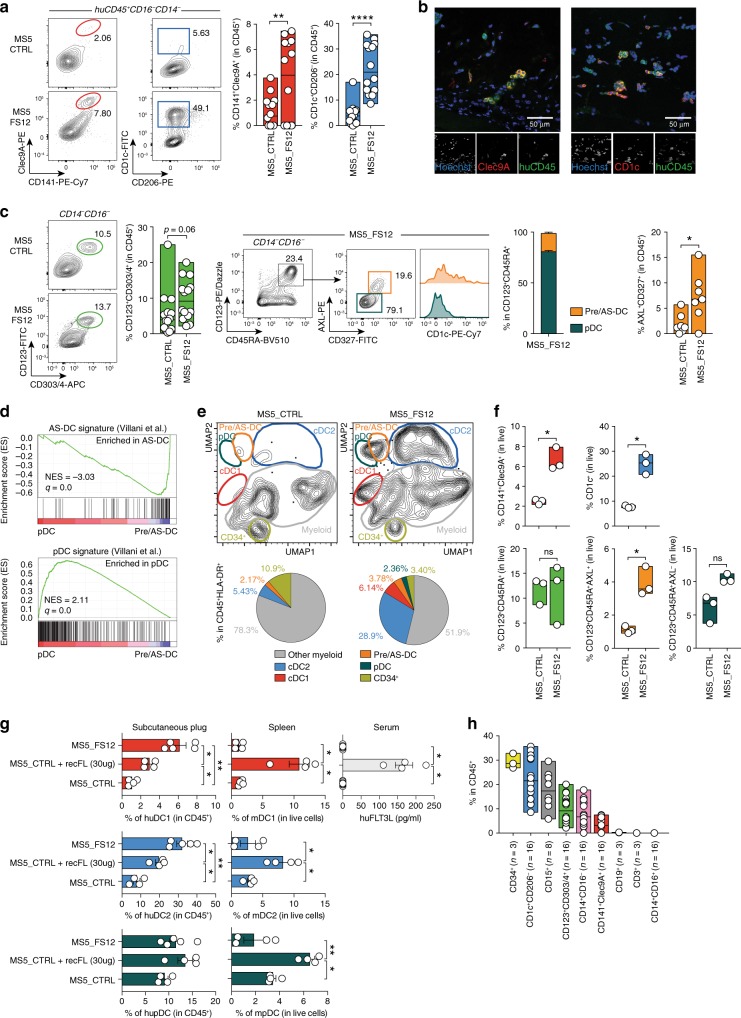
Fig. 6. The MS5_FS12 niche supports human DC development in vivo.
a Flow cytometry of Matrigel organoids containing either MS5_CTRL or MS5_FS12. Graphs show frequency of cDC1 and cDC2 within CD45+ cells (n = 14 donors in 6 independent experiments). **p < 0.01 ****p < 0.0001, two-tailed paired Student’s t-test. b Immunofluorescence of MS5_FS12 organoids sections stained for huCD45+ (green) and Clec9A+ (red) or and CD1c+ (red). Nuclei stained with Hoechst (blue). Scale bar = 50 μm (n = 2 Matrigel organoids). c Left: Flow cytometry and quantification of CD123+CD303/4+ cells in MS5_CTRL and MS5_FS12 organoids (n = 14 donors in 6 independent experiments. Two-tailed paired Student’s t-test). Middle: Gating strategy discriminating AXL−CD327lo/− pDC and AXL+CD327+ pre/AS-DC within CD123+CD45RA+ cells in MS5_FS12 organoids. Bar graph illustrates frequency of each subset within CD123+CD45RA+ cells (n = 4 donors). Right: Frequency of pre/AS-DC within CD45+ cells in MS5_CTRL vs. MS5_FS12 organoids (n = 7 donors in 4 independent experiments). *p < 0.05, two-tailed paired Student’s t-test. d GSEA of pDC and pre/AS-DC using published gene signatures20. Statistical significance defined by the FDR q-value calculated by GSEA software (www.broad.mit.edu/gsea) using default parameters. e CyTOF analysis comparing CD45+HLA-DR+ cells in MS5_FS12 and MS5_CTRL organoids. Pie charts display frequency within CD45+HLA-DR+ cells (mean of n = 2 donors in 2 independent experiments). f Frequency of cDC1, cDC2, pDC, pre/AS-DC and total CD123+CD45RA+ cells recovered from physically separated plugs containing either MS5_CTRL or MS5_FS12 in the same recipient (n = 3 donors in one experiment). *p < 0.05, two-tailed paired Student’s t-test. g NSG mice injected subcutaneously either with MS5_CTRL or MS5_FS12 stromal cells. Human recombinant FLT3L administered intra-peritoneum to mice bearing MS5_CTRL plugs (10 μg/mouse/injection) (MS5_CTRL+recFL). Frequency of human cDC1, cDC2, and pDC in subcutaneous organoids (left) and murine cDC1, cDC2 and pDC in the spleen (center) were reported. Circulating recombinant FLT3L levels were measured by ELISA (right). n = 4 mice/group in 2 independent experiments. *p < 0.05, **p < 0.01, one-way ANOVA test with Dunnett’s T3 multiple comparisons. h Frequency of differentiated subsets within huCD45+ cells in MS5_FS12 plugs at day 12. The number of biological replicates (n) is reported. Data presented as floating bars ranging from min to max and line represents median (a, c, f, h) or as bar graphs with mean ± SEM (c, g).

