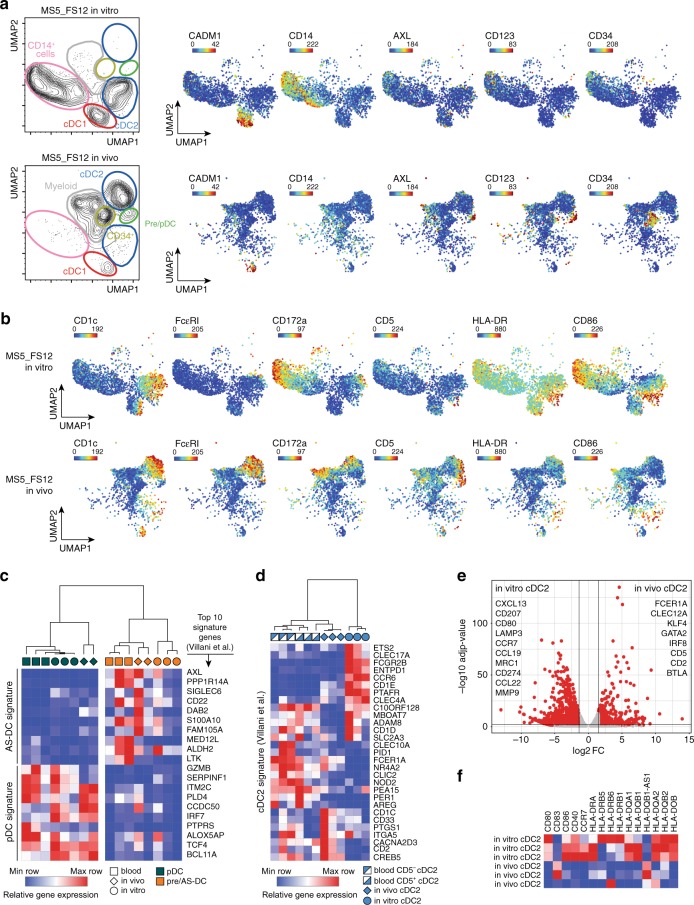
Fig. 7. cDC2 generated in vivo faithfully align to blood cDC2.
a UMAP plots of CyTOF data comparing CD45+HLA-DR+ cells generated using MS5_FS12 stromal cells either in vitro or in vivo. Relative expression of selected markers is shown for each condition. b Relative expression of selected markers highlighting the phenotypic differences between cDC2s generated in vitro and in vivo using MS5_FS12 stromal cells. c Heatmap displaying gene expression of the top ten genes of blood pDC and AS-DC published signatures20 in pDC and pre/AS-DC generated in vitro, in vivo, and isolated from blood PBMC (n = 2 independent donors for pDC and pre/AS-DC generated in vivo and n = 3 independent donors for pDC and pre/AS-DC generated in vitro or isolated from peripheral blood). d Heatmap displaying gene expression of the blood cDC2 published signature20 in cDC2 cells generated in vitro, in vivo and isolated from blood PBMC (n = 3 independent donors). e Volcano plot showing differentially expressed genes between in vitro and in vivo generated cDC2 (Log2FC > 1.5, adjusted p-value < 0.05). Statistical significance was calculated using Wald test with a Benjamin–Hochberg p-value correction (n = 3 independent donors per group). f Heatmap displaying gene expression of activation markers and co-stimulatory molecules expressed in cDC2 generated in vivo and in vitro (n = 3 independent donors).

