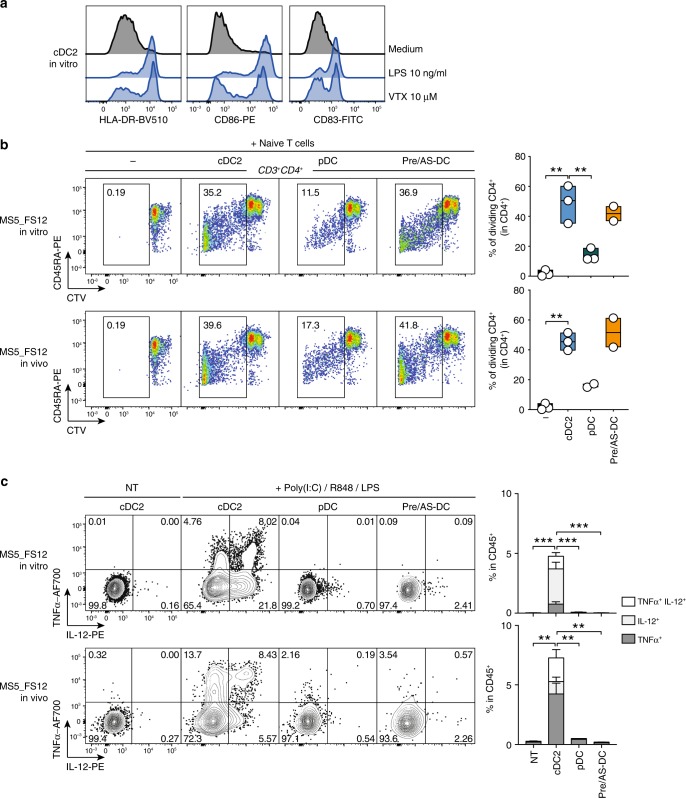
Fig. 8. In vitro and in vivo cDC2 functionally align to blood cDC2.
a Histograms showing upregulation of activation markers HLA-DR, CD86 and CD83 in in vitro-differentiated cDC2 in response to TLR4 (LPS) and TLR8 (VTX-2337) overnight (16 h) stimulation. b Representative FACS plots and quantification of mixed lymphocyte reaction (MLR) using in vitro and in vivo differentiated cDC2, pDC, and pre/AS-DC. FACS-sorted DC subsets were activated overnight (16 h) using a TLR agonist cocktail (LPS 10 ng/ml, R848 1 μg/ml and Poly(I:C) 25 μg/ml) and co-cultured with CTV-labeled naive T cells for 7 days (n = 2 independent donors for pDC generated in vivo and pre/AS-DC generated in vitro and in vivo and n = 3 independent donors for in vitro and in vivo generated cDC2 and in vitro generated pDC in two independent experiments). **p < 0.01, one-way ANOVA test with Holm–Sidak’s multiple comparisons. c Intracellular flow cytometry analysis of TNFα and IL-12 expression in in vitro and in vivo-differentiated DC subsets upon overnight (16 h) stimulation with TLR agonist cocktail (LPS 10 ng/ml, R848 1 μg/ml, and Poly(I:C) 25μg/ml) as compared to unstimulated cells (NT). n = 4 independent cord blood donors. **p < 0.01, ***p < 0.001, one-way ANOVA test Holm–Sidak’s multiple comparisons. Data are presented as floating bars ranging from min to max and line represents median b or as bar graphs with mean ± SEM (c).

