Figure 1.
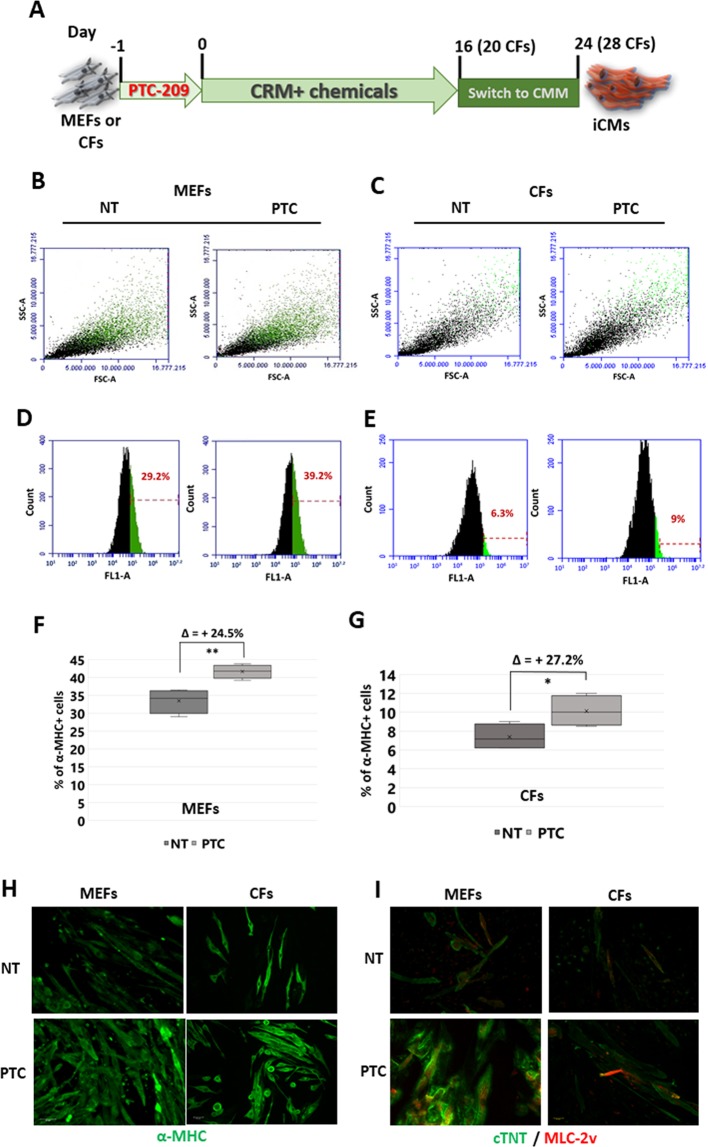
(A) Schematic representation of direct cardiac reprogramming protocol. MEFs or CFs were plated on Matrigel pre-coated plates in fibroblast growth medium containing 1 μM PTC-209 (PTC) or DMSO (NT) one day before the addition of Cardiac Reprogramming Medium (CRM) containing the small molecule cocktails. At day 16 for MEFs or 20 for CFs, the medium was changed into Cardiomyocyte Maintaining Medium (CMM) for at list 10 days more. Samples were analysed at final stage of reprogramming (day 24 or 28, for MEFs and CFs respectively). (B,C) Representative 2D scatter plots showing end-stage reprogrammed cell population upon 24 h PTC-209 pre-treatment (PTC) or DMSO (NT). Green dots represent α-MHC + cells. Typical results obtained starting from MEFs are in (B); those starting from CFs are in (C). (D,E) Representative plots showing fluorescent cells vs total cell counts, with the percentage of α-MHC + cells highlighted in green, at final stage of reprogramming. The increasing in α-MHC + cells upon PTC-209 pre-treatment is shown in (D) for MEFs and in (E) for CFs. (F,G) Box plots showing the percentage of α-MHC + cells, normalized to cell count, at final stage of reprogramming from MEFs (F) or CFs (G). For each data set: n = 4; Δ = mean of % of α-MHC + cell increase upon 24 h PTC-209 pre-treatment. *p < 0.05, **p < 0.01. (H) Representative immunostaining of cardiac marker α-MHC (green). (I) Representative immunostaining of cardiac markers MLC-2v (red) and cTNT (green). Images are related to different areas of beating clusters of iCMs at end-stage of reprogramming from MEFs and from CFs. Scale bars: 40 μM.

