Figure 1.
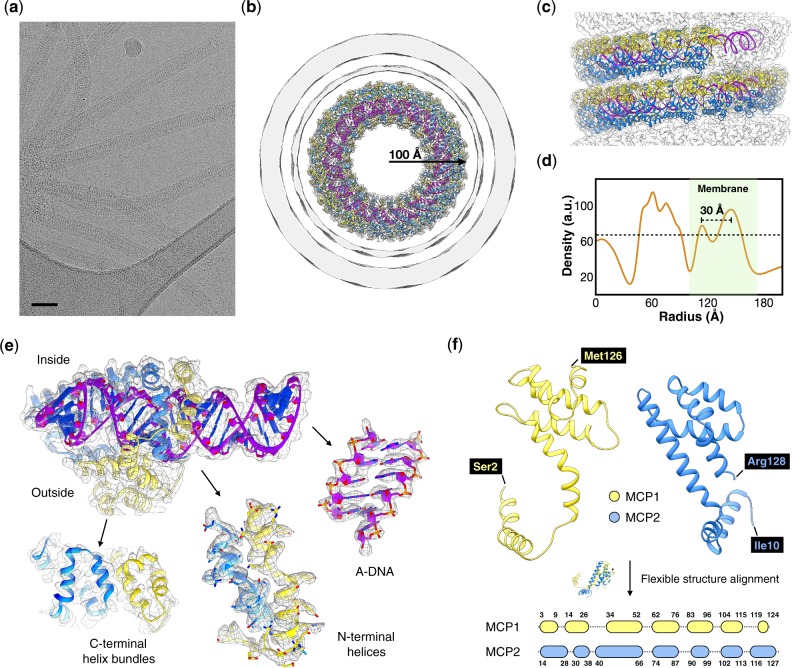
Cryo-EM of the PFV2. (a) Representative cryo-EM micrograph of the PFV2, taken from 5,458 micrographs recorded. Scale bar, 500 Å. (b, c) Three-dimensional reconstruction of PFV2 with atomic model built into the density. A top view (b) shows the nucleoprotein core and enveloping membrane. The membrane has been filtered to 8 Å due to the noise present from imposing the helical symmetry on an unstructured fluid. In the side view (c) the membrane has been removed. MCP1 and MCP2 subunits are in yellow and blue, respectively. A-form DNA is in purple. (d) The average radial density profile of the 3D reconstruction of PFV2. The area corresponding to the membrane is in green. The approximate threshold used for the surfaces shown in (b) is indicated by a dotted line. (e) Close-up views of the density map and fitted models of the MCPs and DNA. MCP1 is in yellow and MCP2 is in blue, while the DNA backbone is in magenta. (f) 3D alignment of MCP1 and MCP2. A flexible secondary structure alignment (bottom) reveals a one-to-one mapping of the local secondary structure elements between the two proteins.

