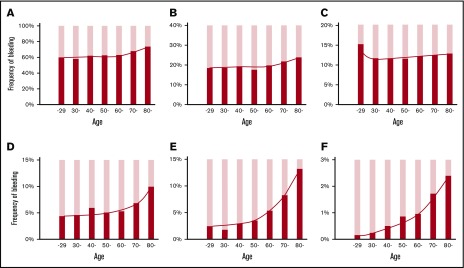
Figure 4.
Relation between age and bleeding manifestations. The frequency of patients with bleeding manifestations is expressed as the percentage of patients with the indicated bleeding manifestation for every 10 years of age. Skin purpura (A); gingival bleeding (B); epistaxis (C); hematuria (D); melena (E); ICH (F). Patients aged ≤29 years and ≥80 years were combined into one column, respectively. The linear and curved line in each graph represents the overall change in the bleeding frequency. Note that each graph has a different y-axis scale.

