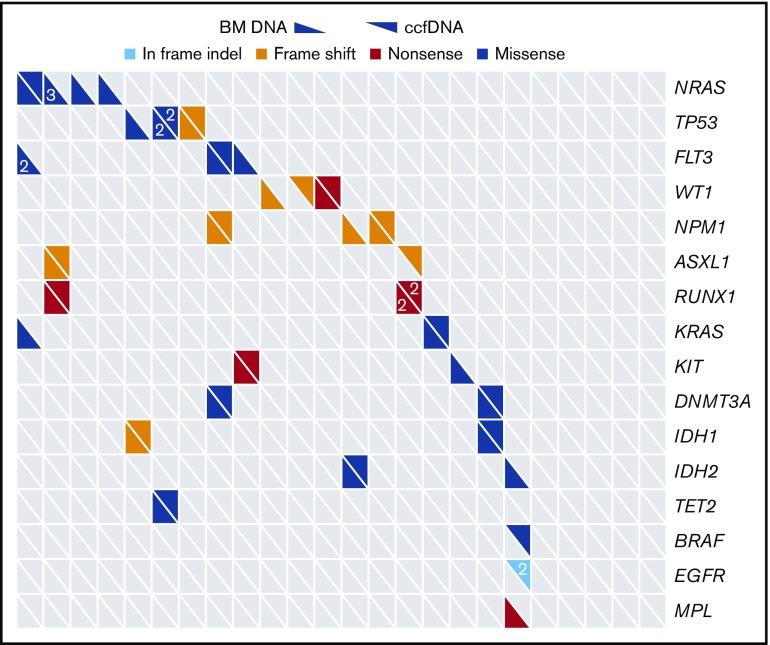
Figure 1.
Distribution of mutations as detected by targeted sequencing of ccfDNA and bone marrow (BM). Only genes sequenced by both assays are included. Each column represents a unique patient with AML (N = 22), and each row represents a gene that was detected in at least 1 patient. Numbers, when present, indicate when >1 mutation of a given gene were detected in the same patient.

