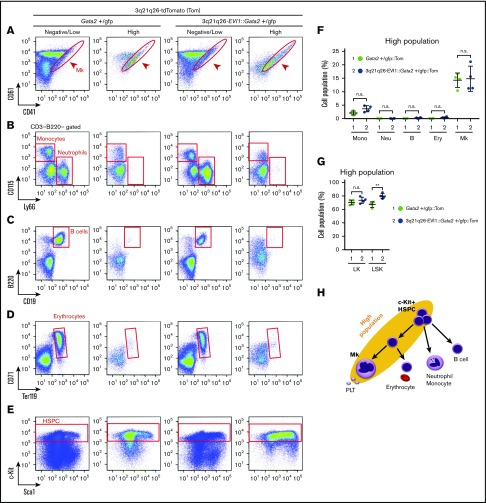
Figure 2.
EVI1 plus Gata2 High fraction contains HSPC and Mks. (A-E) Representative flow cytometric profiles of High and Low/Negative populations in Gata2+/gfp::Tom and 3q21q26-EVI1::Gata2+/gfp::Tom mouse bone marrows. Red circles and boxes in each panel represent populations of Mk cells (A), monocytes and neutrophils (B), B cells (C), erythrocytes (D), and HSPC (E). (F) Percentages of High population cells falling into cell type-specific gated fractions from Gata2+/gfp::Tom (green circle) and 3q21q26-EVI1::Gata2+/gfp::Tom (blue circle) mouse bone marrows; monocytes (Mono), neutrophils (Neu), B cells (B), erythroid cells (Ery), and Mks. (G) Percentages of High populations in LK and LSK fractions from Gata2+/gfp::Tom (green circle) and 3q21q26-EVI1::Gata2+/gfp::Tom (blue circle) mouse bone marrows. (H) Cell populations contained in High population (yellow background ellipse). Note that HSPC and Mk-lineage cells are both enriched in the High population. Values represent the means ± SD. **P < .01 (unpaired Student t test).

