
Figure 8.
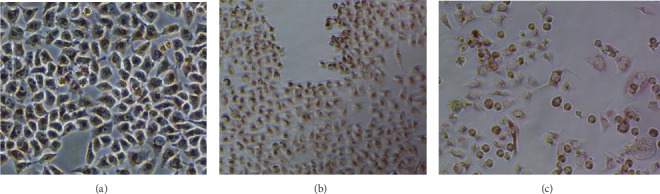
Phase-contrast microscopy of HeLa cells treated with different concentrations of silver nanoparticles. (a) Untreated cells (control). (b) Cells treated with NPs at a concentration of 60 μg/ml. (c) Cells treated with NPs at a concentration of 240 μg/ml showing morphological deformities such as lysis and rounding off.