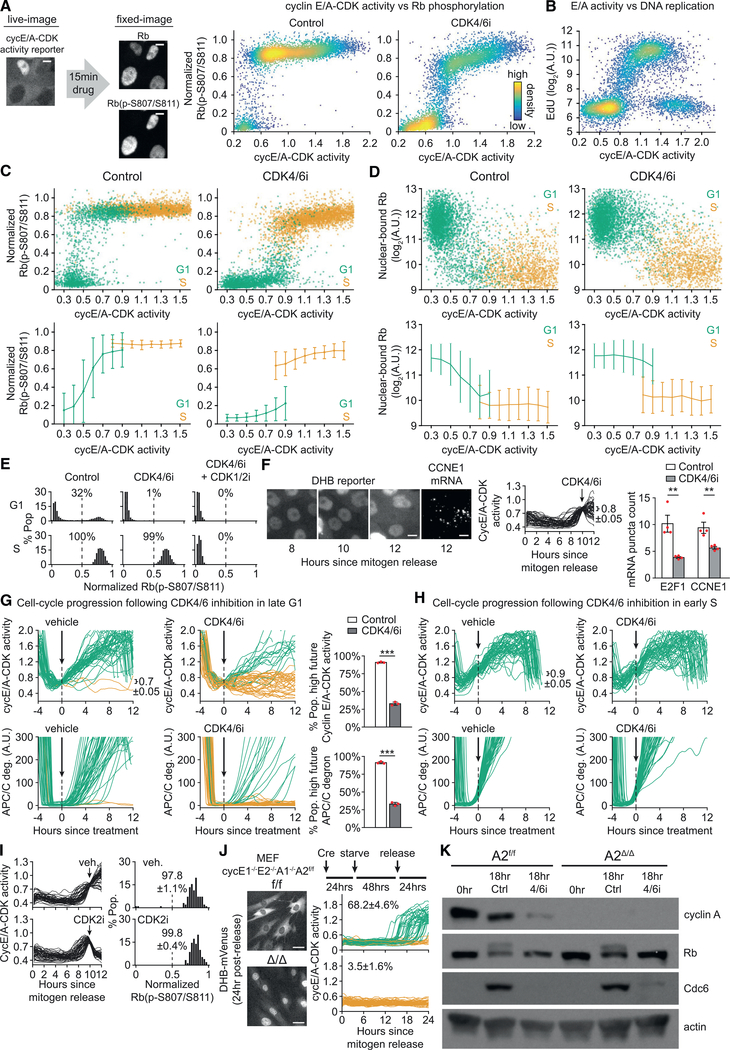
Figure 3. CDK4/6 Activity Is Continuously Required throughout G1 to Maintain Rb Hyperphosphorylation.
(A) Cycling MCF-10A expressing cyclin E/A-CDK activity reporter were live-cell-imaged and treated with CDK4/6i or vehicle for 15 min, followed by fixing andstaining for normalized Rb(p-S807/S811). Scale bar, 5 μm. Single-cell correlation of cyclin E/A-CDK activity just prior to drug treatment versus the resulting phospho-Rb signal. n = 7,000 cells per condition.
(B) Same cells as in (A) treated with EdU for 15 min prior to fixing. Scatterplot of cyclin E/A-CDK activity just prior to EdU treatment versus EdU incorporation.n = 20,000 cells.
(C) Same cells and assay as (A), except EdU included with 15 min drug treatment. Cells additionally stained with Hoechst and gated as shown in Figure S2A for G1 (green) or S (gold). Top: scatterplot of cyclin E/A-CDK activity just prior to drug treatment versus the resulting phospho-Rb signal. Bottom: same data for scatterplots binned by cyclin E/A-CDK activity. Error bars are SD; n = 8,000 cells per condition.
(D) Similar assay as (C), but in situ extraction performed prior to fixing and staining for Rb. n = 8,000 cells per condition.
(E) Cycling MCF-10A treated with indicated drugs + EdU for 15 min prior to fixing and staining for normalized Rb(p-S807/S811). CDK1/2i III 3 μM used. Cells stained for Hoechst and computationally gated by G1 (top) and S (bottom). Percentage of cells with normalized Rb(p-S807/S811) > 0.5 indicated. n > 2,318 cells per condition.
(F) Live-plus-fixed imaging with mRNA expression measured with RNA FISH, followed by computational gating for E/A = 0.8 ± 0.05 at the time of drug treatment.Scale bar, 10 μm. Fifty sample traces shown. n > 95 cells per condition; n = 4 biological replicates; error bars are SEM; two-sample t test: E2F1, p = 3.71E-3; CCNE1, p = 6.95E-3.
(G) Cycling MCF-10A expressing cyclin E/A-CDK activity reporter, APC/C degron reporter to report S-phase entry (see Figures S2G and S2H), and H2B-mTurquoise were live-cell-imaged and treated with vehicle or CDK4/6i for 12 h, then gated for E/A = 0.7 ± 0.05 and no increase in APC/C degron at time of drug treatment. High future E/A activity defined as > 1.2 after 12 h. High future APC/C deg defined as >100 after 12 h. Fifty sample traces shown. n > 83 cells per condition; n = 3 replicates; SD; two-sample t test: E/A, p = 2.36E-6; APC/C, p = 3.54E-6.
(H) Same experiment as (G), except cells gated for E/A = 0.9 ± 0.05 and rising APC/C degron at time of drug treatment. Fifty sample traces.
(I) Mitogen-released MCF-10A expressing cyclin E/A-CDK activity reporter live-imaged and treated with CDK2i III 60 μM for 2 h prior to fixing and staining for Rb(p-S807/S811). Cells gated for E/A = 0.8 ± 0.05 at time of drug treatment.
(J) Indicated MEFs expressing cyclin E/A-CDK activity reporter treated as shown and live-imaged. Scale bar, 40 μm. Fifty sample traces per condition shown.
Percentages of cells with E/A > 0.65 at 24 h. Errors are SD of n = 3 replicates.
(K) Same assay as (J), except cells released along with CDK4/6i or vehicle and harvested at indicated times for western blot. Hyperphosphorylation of Rb can be seen as an upper band in the 18 h control lanes. Representative of two replicates. Control/vehicle (DMSO), CDK4/6i (palbociclib) 1 μM, and EdU 10 μM wherever indicated.
See also Figure S2.

