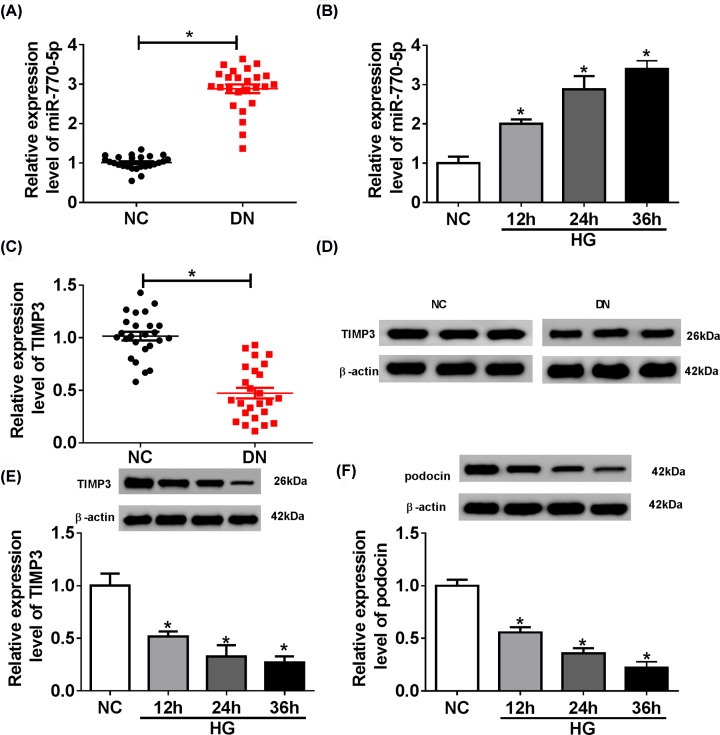
Figure 1. Expression levels of miR-770-5p and TIMP3 in DN kidney tissues and HG-induced podocytes.
(A and B) The expression level of miR-770-5p was measured in DN kidney tissues and HG-induced podocytes and their control tissues and podocytes by qRT-PCR. (C–E) The expression level of TIMP3 was examined in DN kidney tissues and HG-induced podocytes and their control tissues and podocytes by qRT-PCR and Western blot. (F) The protein level of podocin was detected in podocytes treated with high glucose at different times by Western blot; *P<0.05.

