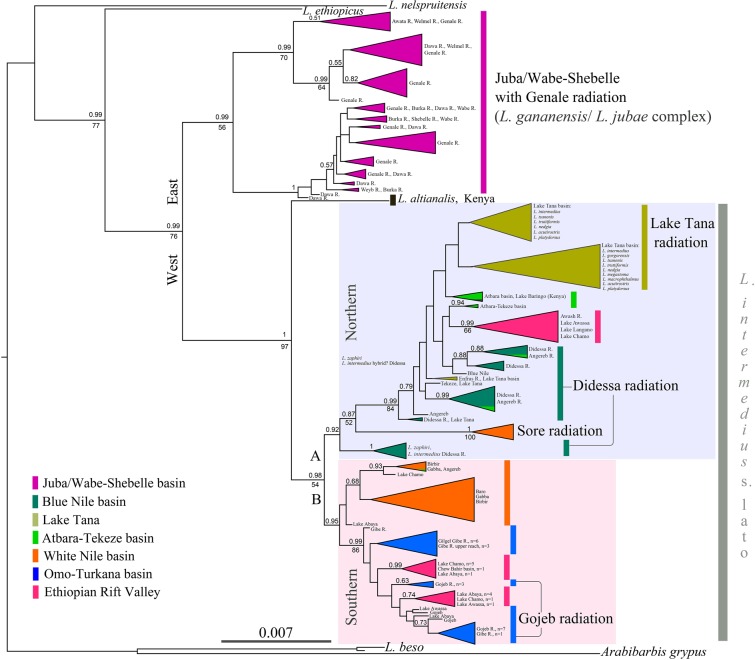
Figure 3.
Bayesian inference majority-rule consensus tree of relationships among the Ethiopian Labeobarbus from all main drainages including all unique haplotypes based on cytb sequences. Bayesian posterior probabilities (above) from BI analysis and bootstrap values from ML analysis (beneath) above 0.5/50 are shown. Scale bar and branch lengths are given in expected substitutions per site. The nodes were collapsed to a triangle, with the horizontal depth indicating the level of divergence within the node. The phylogenetic tree was visualized using FigTree v.1.4.4106.

