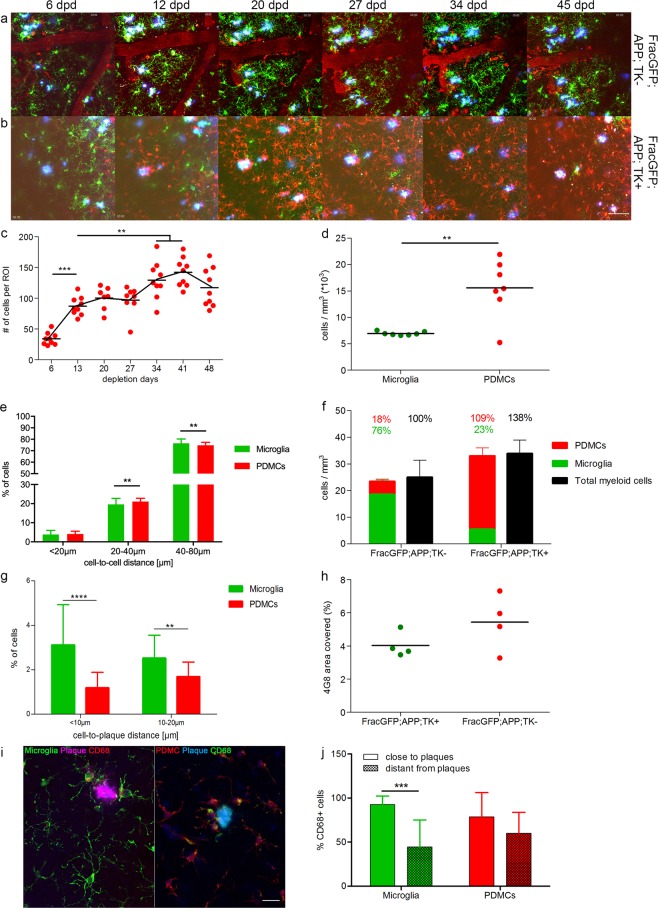
Figure 2.
In vivo imaging of the replacement of endogenous microglia by peripherally-derived myeloid cells in an AD-like environment. (a,b) Representative images of 2-photon imaging sessions, for Frac-GFP;APP+;TK− (a) and Frac-GFP;APP+;TK+ (b) mice at indicated time points after surgery. GFP-positive cells represent endogenous microglia and RFP-positive cells represent PDMCs. Aβ plaques were stained by injecting Methoxy-X04 one day before each imaging session); scale bar = 100 µm. (c) Number of PDMCs per field of view over time; n = 7; df = 59; 1-way ANOVA with Tukey post-hoc test; **p < 0.01, ***p < 0.001. (d) Post mortem stereological quantification of microglia (FracGFP;TK−) and PDMC (FracGFP;TK+) cell density per mm3; n = 7; df = 12; Unpaired t-test; **p < 0.01. (e) Cell-to-cell distance of endogenous microglia (green bars) and PDMCs (red bars). Each field of view of the first minute of each imaging session was analysed in Imaris with the spot recognition algorithm. The xyz coordinates of spots were exported and the Euclidian distances between cells were measured for every detected cell with a custom written algorithm; n = 6, 3 fields of view per animal; df = 678; 2-way ANOVA with Sidak post-hoc test; interaction < 0.0001; **p < 0.01. (f) Distribution of PDMCs and microglia relative to total Iba1+ cells based on post mortem stereological quantification; n = 4. (g) Cell-to-plaque distance of endogenous microglia (green bars) and PDMCs (red bars). Each field of view of the first minute of each imaging session was analysed in Imaris with the spot recognition algorithm. The xyz coordinates of spots and plaques were exported and the Euclidian distances between cells and plaques were measured for every detected cell with a custom written algorithm; n = 6, 3 fields of view per animal; df = 327; 2-way ANOVA with Sidaks post-hoc test; interaction ns; **p < 0.01 ****p < 0.0001. (h) Morphometric analysis of area covered by 4G8 positive amyloid plaques; n = 4; Unpaired t-test ns. (i) maximum intensity projections of confocal stacks, showing a representative image of activated myeloid cells around plaques (distance < 10 µm) and less activated myeloid cells distant from the plaque; scale bar = 25 µm. (j) Quantification of the percentage of CD68 + activated myeloid cells close and distant from plaques; n = 3 animals, 4-6 fields of view per animal; 2-way ANOVA with Bonferroni post-hoc test; df = 57; interaction; ***p < 0.001.

