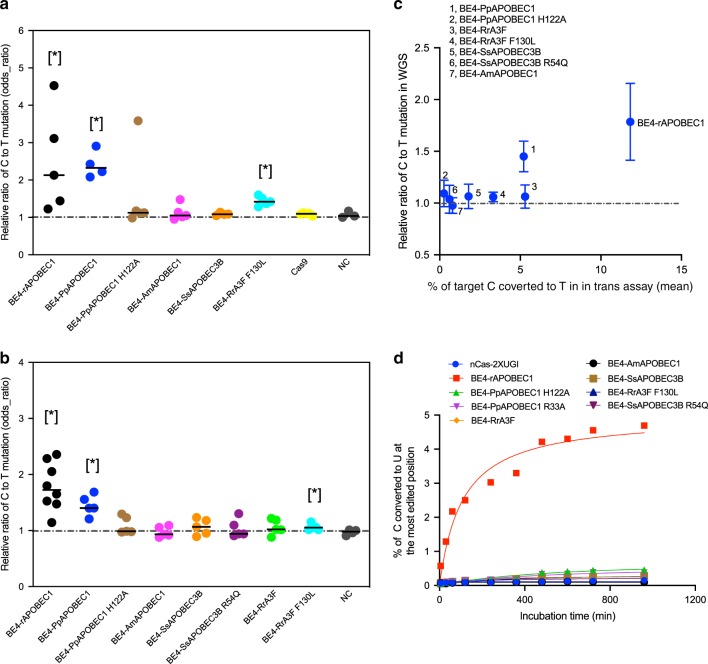
Fig. 4. Next-generation CBEs with reduced DNA off-target editing efficiency relative to BE4 in HEK293T cells.
Relative ratio of C-to-T mutation (odds ratio) of single cell expansions treated with base editor plasmid (a) and mRNA (b). Each dot represents one WGS sample from different single cell expansions. The odds ratios quantify the fold change in mutation rates for the editor-induced mutation type (C->T), with an odds ratio of 1 implying no change from untreated cells. The black line represents the median of n = 3, 4, 5, and 8 biological replicates, as can be determined for each sample by the number of included data in the graph. P values were calculated using one-sided Mann Whitney U test between the test group and the untreated group, and *P value < 0.05. P value: a BE4-rAPOBEC1, 0.018; BE4-PpAPOBEC1, 0.026; BE4-BE4-RrA3F F130L, 0.018; b BE4-rAPOBEC1, 0.004; BE4-PpAPOBEC1, 0.010; and BE4-RrA3F F130L, 0.010. c correlation between relative ratio of C-to-T mutation in each WGS sample treated with base editor mRNA and percentage of C-to-T conversion in in trans-assay shown in Supplementary Fig. 8. The values and error bars for y-axis reflect the mean and s.d. of n = 3, 4, 5, and 8 biological replicates, as can be determined for each sample by the number of included data in the b. Value for x-axis reflect the mean editing efficiency at targets 1–10 from n = 4 independent biological replicates. d C-to-U editing efficiency of selected CBEs on DNA oligo 1 in in vitro enzymatic assay. Sequence of the oligo is listed in Supplementary Table 3. Values and error bars reflect the mean and s.d of n = 2 independent biological replicates from y = 2 experiments. All data presented are provided as Source Data.

