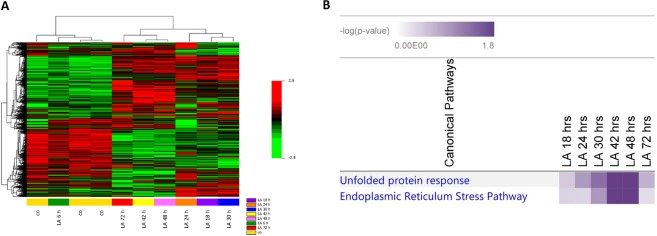
Figure 2.
Gene expression profiling in α-LA-treated FaO cells. (A) Hierarchical clustering of genes expression profile in α-LA-treated cells. Each row represents the expression profile of a gene and each column represents a sample. Controls and treated cells at different time points, from 6 up to 72 hours, are indicated by colored bars. Red and green colors represent higher and low relative gene expression, respectively. (B) Functional analysis of differentially expressed genes in α-LA-treated cells.

