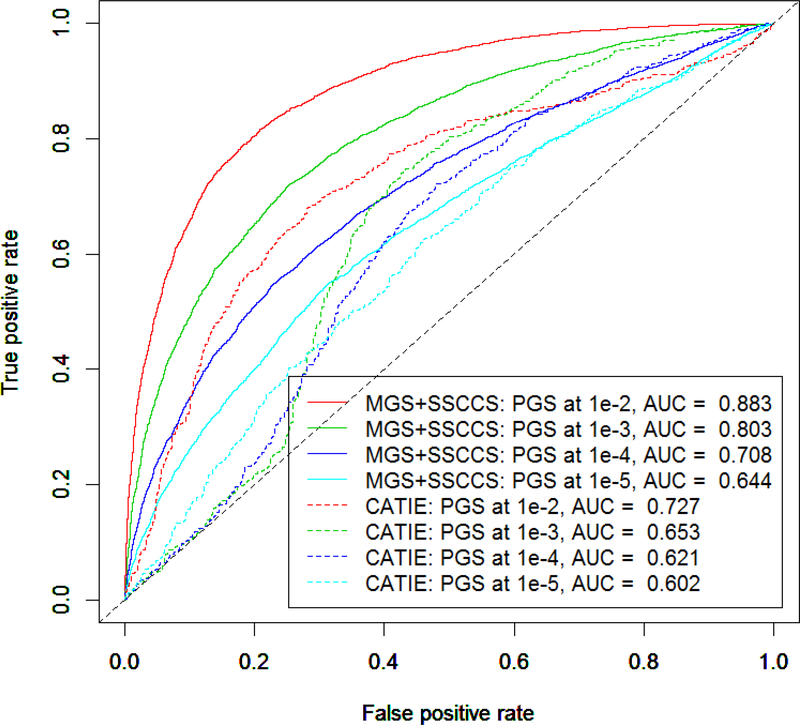
Figure 2.
The effect of PGS threshold on prediction power. In a logistic regression model, schizophrenia sPGSs calculated at different thresholds were used to predict schizophrenia diagnosis. The figure showed the AUC curves that sPGSs calculated at different thresholds (indicated by colors) had significant effects on the performance of the prediction models in both the MGS+SSCCS (solid lines) and CATIE (dashed lines) datasets. The differences between the MGS +SSCCSS and CATIE datasets were also noted.

