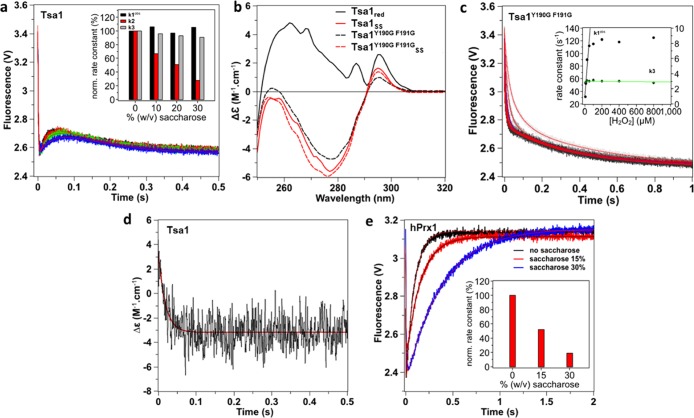
Figure 3.
Attribution of phase 2 to a conformational transition. (a) Effect of saccharose (0% black, 10% red, 20% green, and 30% blue) on the reaction of Tsa1 (5 μM) with H2O2 (10 μM) monitored as in Figure 2, fitted against a three-exponential equation (red lines). Inset: effect of saccharose concentration on rate constants k1obs, k2, and k3 normalized to 0% saccharose. The stopped-flow mixer efficiency in viscous solutions was established by mixing Trp and up to 30% saccharose, which showed no artifactual effects on the dilution kinetics (Figure S2). (b) Near-UV circular dichroism spectra of 50 μM wild-type Tsa1 (plain) and Tsa1Y190G F191G (dashed line) under the reduced (black) and disulfide (red) forms. Measurements were performed in a 1 cm cuvette in a phosphate 10 mM and NaF 100 mM buffer (pH 7) and are the average of three records. (c) Pre-steady-state kinetics for the reaction of Tsa1 (5 μM) with H2O2 (5, 10, 25, 50, 100, 200, 400, and 800 μM, light gray to black) monitored as in Figure 2, fitted against a biexponential equation (red lines). Inset: second-order plots and linear fits of the observed rate constants for the fast phase k1obs (circles, black line) and slow phase k3 (diamond, green line). (d) Pre-steady-state kinetics for the reaction of Tsa1 (50 μM) with H2O2 (100 μM) monitored by a near-UV CD signal at 270 nm. The trace is the average of 50 runs, and the first-order fit is shown in red. (e) Effect of saccharose (0% black, 15% red, and 30% blue) on the reaction of human Prx1 (5 μM) with H2O2 (10 μM) monitored as in Figure 2 and fitted against a biexponential equation (red or black lines). Inset: effect of saccharose concentration on the rate constant of the increasing phase normalized to 0% saccharose.

