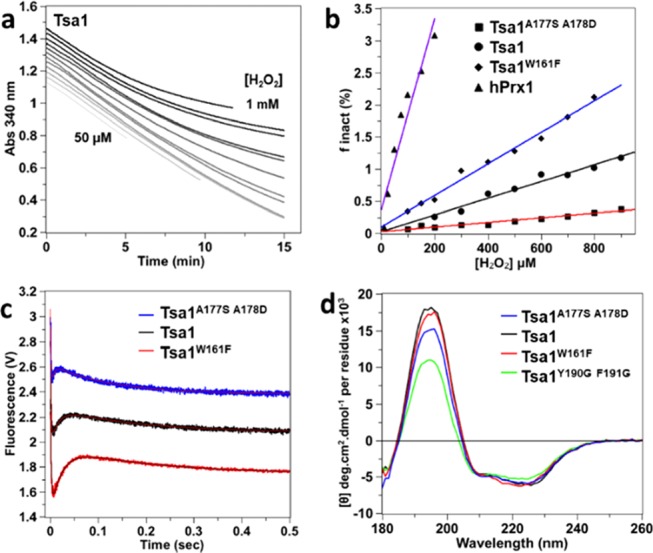
Figure 4.

Steady-state hyperoxidation sensitivity of wild-type and mutant Tsa1 with H2O2. (a) Steady-state kinetics for the determination of hyperoxidation sensitivity of Tsa1 monitored by consumption of NADPH (200 μM) at 340 nm in the presence of thioredoxin reductase (0.25 μM), Trx (5 μM), Tsa1 (1 μM), and variable amounts of H2O2 (from 50, 100, 150, 200, 300, etc. to 1 mM) in TK buffer. The time courses have been shifted on the y axis for clarity. (b) Secondary plot of the inactivated fraction finact per turnover deduced from (a) vs H2O2 concentration. The hyperoxidation index Chyp1% is deduced from the slope of the linear fit for wild type (black circles, black line fit), mutants Tsa1W161F (black diamonds, blue line fit) and Tsa1A177S A178D (black squares, red line fit), and hPrx1 (black triangles, purple line fit). Data are the mean of two independent experiments. (c) Pre-steady-state kinetics for the reaction of Tsa1A177S A178D, Tsa1, or Tsa1W161F (5 μM, top to bottom) with H2O2 (10 μM) monitored by Trp fluorescence as in Figure 2b, fitted against a three-exponential equation (red or black line). Time courses have been shifted on the y axis for clarity. (d) Far-UV CD spectra of 5 μM Tsa1 (black), Tsa1W161F (red), Tsa1A177S A178D (blue), and Tsa1Y190G F191G (green) under the reduced state. Measurements were performed in a 0.01 cm flat cell in phosphate (10 mM) NaF (100 mM) buffer (pH 7) and are the average of three records.
