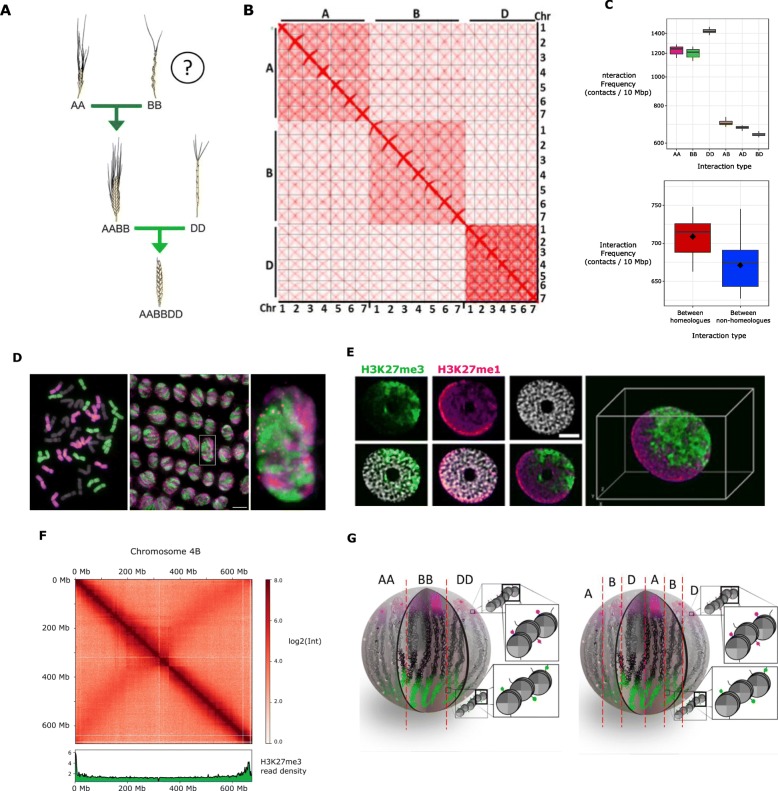
Fig. 1.
Large-scale chromatin architecture analysis of hexaploid wheat. a Schematic representation of the relationships between wheat genomes, showing the polyploidization history of hexaploid wheat. b Hi-C contact matrix of the hexaploid wheat genome. c Box plots representing the distribution of the median interaction frequency between 10-Mb bins for each combination of subgenomes (upper panel) and between homoeologous and non-homoeologous chromosomes of different subgenomes (bottom panel). d Root meristematic cells of T. aestivum cv. Chinese Spring labeled by GISH. The A genome is labeled in magenta, the D genome is labeled in green, and the B genome is not labeled and thus appears in gray; telomeres are labeled in red. (Left panel) metaphase cells showing 14 A chromosomes, 14 B chromosomes, and 14 D chromosomes. (Middle panel) interphase cells. (Right panel) zoom-in of the interphase nucleus indicated by the white box in the middle panel. Scale bar represents 10 μm. e Immunofluorescence detection of H3K27me3 (green) and H3K27me1 (purple) in the isolated nucleus. f Integration of H3K27me3 and Hi-C at the chromosomal level. The heatmap of intrachromosomal interaction frequency of chromosome 4 B (in red, upper panel) is presented together with the read density of H3K27me3 ChIP-seq (in green, lower panel). The genomic coordinates are indicated on the left side of the heatmap for Hi-C and under the read density plot for H3K27me3. The color bar on the right side of the heatmap shows the interaction frequency scale. g Alternative models of large-scale chromatin architecture in the nucleus of wheat

