Fig. 2.
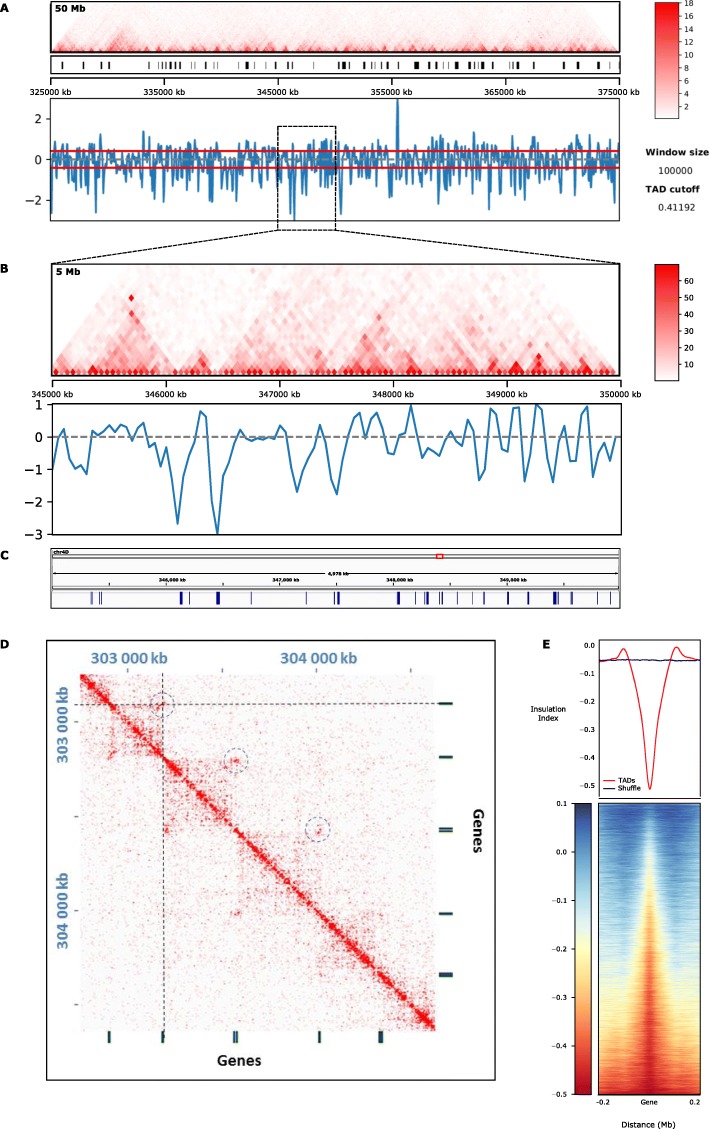
The wheat genome displays ICONS. a TADtool analysis of a 50-Mb region of chromosome 4D (Chr4D:325000000-375000000). Triangle heatmap of Hi-C interaction frequency (top panel), positions of the identified TADs indicated by black bars (middle panel), and plot of the insulation index (bottom panel). b Zoom-in of the 5-Mb region of Chr4D:345000000-350000000 in a, showing a triangle heatmap of Hi-C interaction frequency (top panel) and insulation index (bottom panel). c Position of genes along the 5-Mb region shown in b. d 2D heatmap showing the interaction frequency in a region (chr3B-1000000–5000000) of the Hi-C map. The dashed circles highlight the hotspots of interaction. Genes are represented by black bars. e Level of insulation index on genes. Median insulation index over genes (red line) and random genomic intervals (blue line) (top panel). Heatmap of insulation index over genes (bottom panel)

