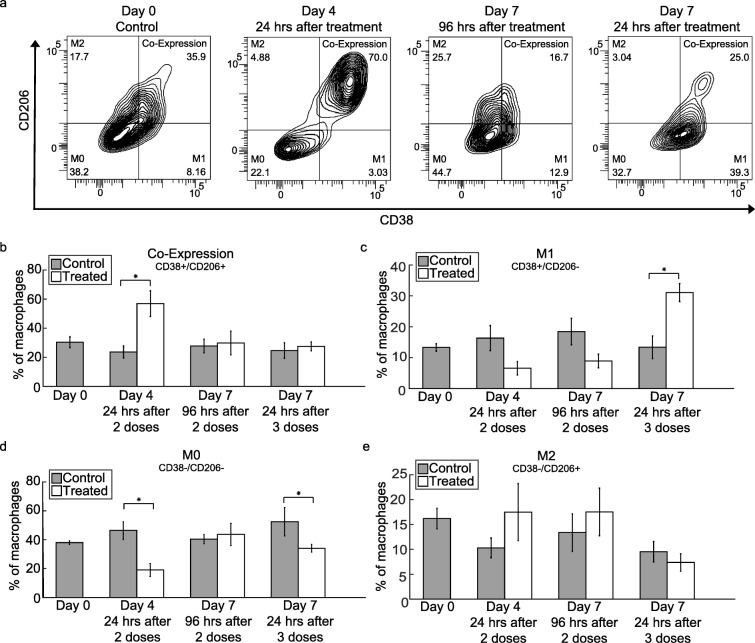
Fig. 3.
Macrophage phenotypes transition over the course of trastuzumab treatment. a Representative flow cytometry graphs of Day 0 control tumors and Day 4 and Day 7 trastuzumab treated tumors (96 and 24 h after treatment). Visual increases are observed in CD38+/CD206+ co-expressing macrophages on Day 4, 24 h after treatment and CD38+/CD206- M1 macrophages on Day 7, 24 h after trastuzumab treatment. b Percent of macrophages co-expressing CD38 and CD206 is shown revealing a significant increase (P = 0.02) from control in Day 4 treated tumors, after two doses of trastuzumab. c Percent of macrophages with an M1 phenotype (CD38+/CD206-) is shown revealing a significant increase (P = 0.02) in the M1 macrophage population in treated Day 7 tumors after three doses of trastuzumab. d Percent of macrophages with a non-differentiated, M0 phenotype (CD38−/CD206-) is shown revealing a significant decrease in population observed on Day 4 (P = 0.02) and Day 7 (P = 0.03), 24 h after treatment. e Percent of M2 macrophages (CD38−/CD206+) (no significant differences were observed between control and treated tumors)

