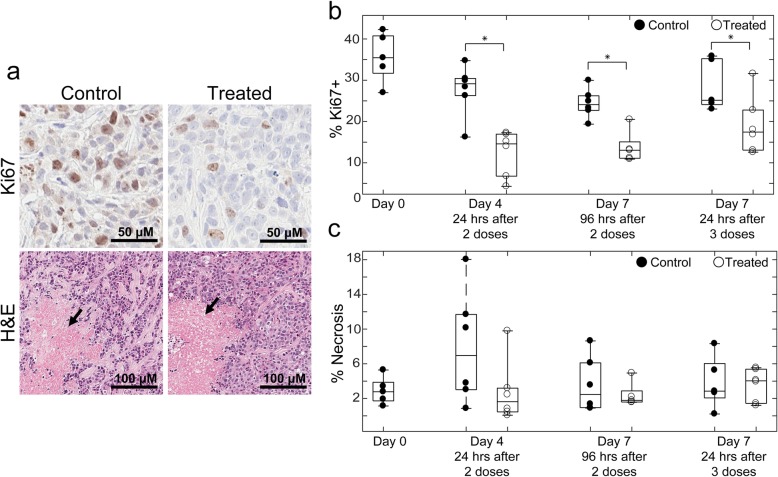
Fig. 7.
Quantitative analysis of Ki67 and necrosis in IHC stained samples. a Representative images of Ki67 (top) in control and treated Day 4 tumors are shown. Necrotic sections from H&E (bottom) indicated with black arrow in control and treated Day 4 tumors. b Percent nuclei Ki67+ in control and trastuzumab treated tumors. In all treatment groups, there was a significant decrease (P ≤ 0.05) in Ki67+ nuclei, validating treatment response. c Percent necrotic area in control and treated tumors (no significant differences were observed between control and treated tumors)

