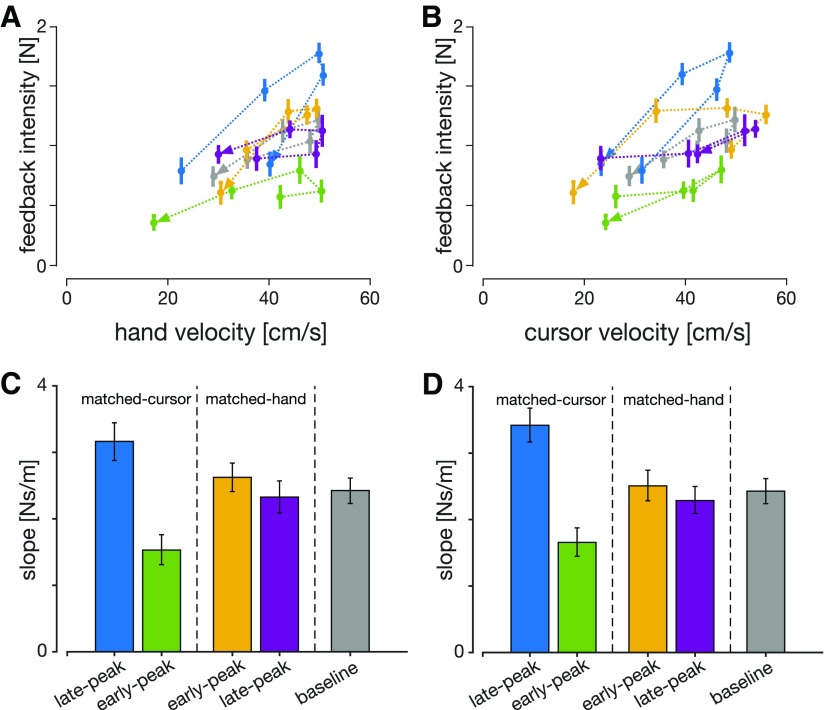
Figure 4.
Visuomotor feedback intensities as a function of (A) hand velocity and (B) cursor velocity at the time of perturbation for all experimental conditions. Error bars represent 1 SEM, and the arrowheads represent the order of the perturbation locations. C, D, Regression slopes of feedback intensities for each condition as a function of hand and cursor velocities, respectively. Error bars represent 95% confidence intervals of the slopes. The slopes for the two matched-cursor conditions were significantly different (based on the confidence intervals) than for the baseline condition.

