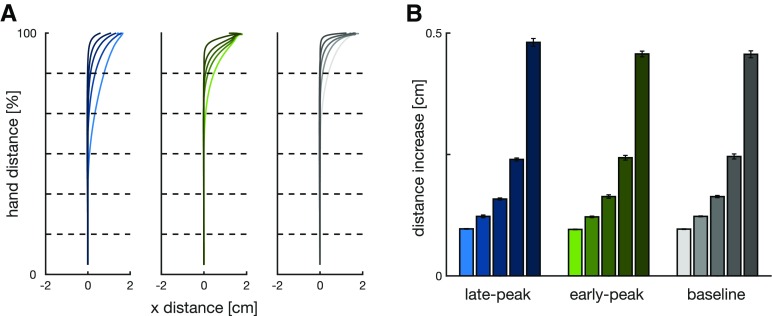
Figure 5.
A, Mean hand movement trajectories for matched-cursor late-peak (left), matched-cursor early-peak (middle), and baseline (right) conditions recorded in our participants, with perturbation onset at five locations [color light to dark: 4.2 cm (16.7%), 8.3 cm (33.3%), 12.5 cm (50%), 16.7 cm (66.7%), and 20.8 cm (83.4%) from the start position; dashed lines]. Corrections to rightward perturbations were flipped and combined with leftward corrections. B, Distance increase for each perturbation location recorded in our participants. Perturbation locations closest to the target required the largest increases in movement distance. Error bars represent 1 SEM.

