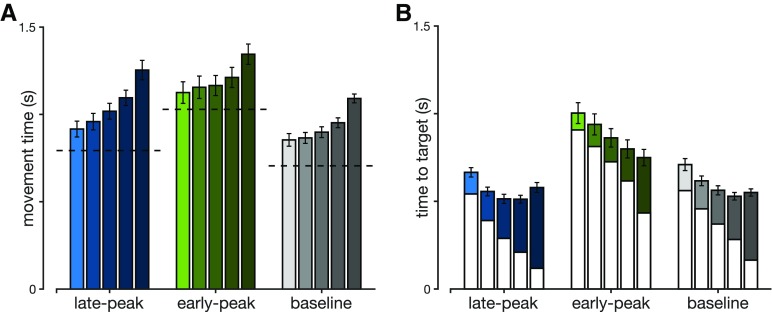
Figure 6.
A, Movement durations in maintained perturbation trials recorded by our participants in late-peak, early-peak and baseline conditions. Separate bars within the same color block represent different perturbation onset locations (left to right: 4.2, 8.3, 12.5, 16.7, and 20.8 cm from the start position). Error bars represent 1 SEM while the horizontal dashed lines represent movement durations in the same movement condition for non-perturbed movements. B, Full bars represent times-to-target (time between a perturbation onset and target interception) in maintained perturbation trials in our participants for late-peak, early-peak, and baseline conditions. White bars represent the time-to-target for a respective non-perturbed movement, at the time when the perturbation would have happened. The colored part of the bars represents the extension in times-to-target due to the perturbation in a non-constrained movement. This shows that the perturbation during the movement evokes an extension in the time-to-target and subsequently in movement duration Each of the five bars represents a different perturbation onset location, as in A. Error bars represent 1 SEM.

