Figure 8.
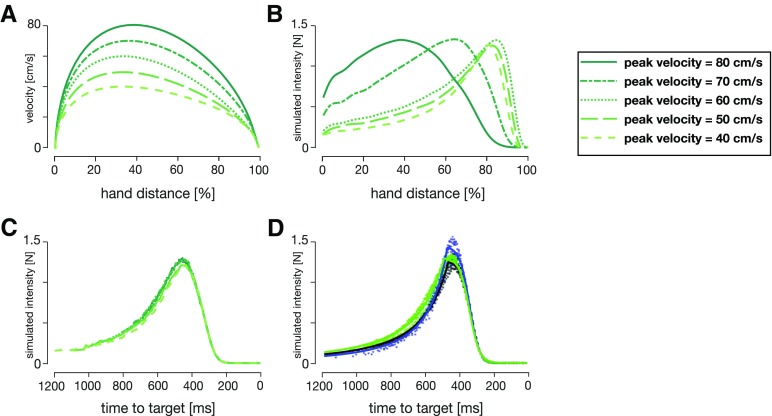
OFC simulations of (A) velocity profiles and (B) simulated feedback intensity profiles for different desired peak velocities (in order from light to dark line colors: 40, 50, 60, 70, and 80 cm/s). C, Simulated feedback intensities of (B) re-mapped as a function of time-to-target at the time of perturbation. D, Simulated feedback intensities vs time-to-target for the three kinematic conditions over the five peak velocities simulated by OFC (colored dots). Solid lines represent the tuning curves (Eq. 7) fit to the data. Both the tuning curves and the simulated feedback intensity profiles are similar across a variety of different kinematics when expressed as a function of time-to-target.

