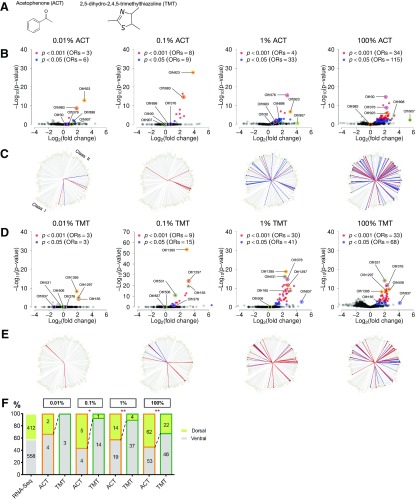
Figure 2.
OR repertoires expand with increasing ACT and TMT concentrations. A, Chemical structure of ACT and TMT. B, D, Volcano plots showing the log2 fold change and -log10 p value (FDR corrected) of OR genes from 0.01% to 100% starting concentrations of ACT and TMT. OR differential expression values are based on pS6-IP-Seq comparing odorant stimulated and unstimulated C57BL6 mice. ORs significantly enriched by pS6-IP-Seq with positive fold change are colored in blue and red based their p values (FDR corrected). N = 3 mice were used for each odorant condition. B, Six ACT responsive ORs: Olfr923, Olfr983, Olfr376, Olfr898, Olfr907, and Olfr30 are labeled. D, Seven TMT responsive ORs: Olfr1395, Olfr1297, Olfr165, Olfr531, Olfr506, Olfr837, an Olfr376 are labeled. C, E, Protein sequence distance trees generated using similarity based on pairwise distances from aligned OR protein sequences. Each end of the branches represents an OR placed alongside its closest neighbors. Both class 1 (bottom left ¼ the tree) and class 2 (remaining ¾ of the tree) ORs are shown. ORs significantly enriched by ACT and TMT at each odorant concentrations are labeled in red (FDR corrected p < 0.001) and blue circles (FDR corrected p < 0.05). F, Stacked bar graphs showing the zonal location of ACT and TMT activated ORs across various concentrations. Orange and green colors outline ACT and TMT graphs, respectively; *p < 0.05, **p < 0.01, by Fisher’s exact test (ACT compared with TMT). N = 3 mice olfactory epithelium were used in RNA-Seq to determine OR zonal positions. See Extended Data Figure 2-1 for zonal index comparisons. See Extended Data Figures 2-2, 2-3, 2-4, 2-5, 2-6, 2-7, 2-8, 2-9, 2-10, 2-11, and 2-12 for differential expression data supporting this figure.

