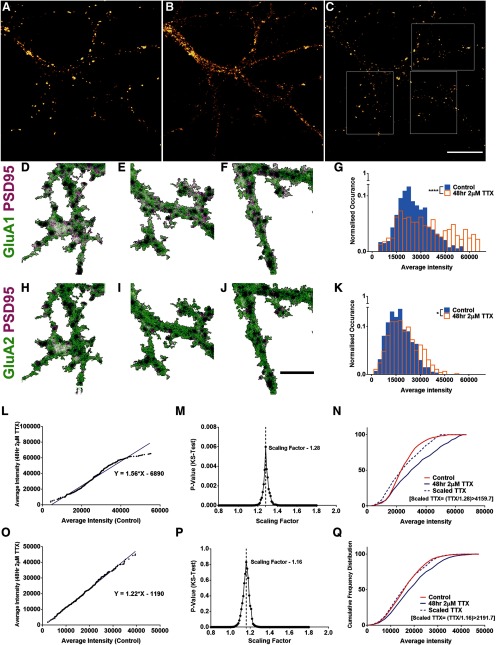
Figure 1.
Multiplicative scaling of excitatory synapses using rank order analysis. A–C, Mice hippocampal neurons of DIV14 treated for 48 h with 2 μM TTX to study homeostatic synaptic scaling. The cultures were fixed and immunolabelled for the C terminus of AMPA receptor subunits GluA1 (A), GluA2 (B), and a PSD protein PSD95 (C). D–F, H–J, Representative dendritic compartments of the images in A–C with PSD95 in magenta and GluA1 (D–F) or GluA2 (H–J) in green. Scale bars: 10 μm (A–C) and 5 μm (D–F, H–J). G, K, A histogram was plotted for the average intensity of GluA1 (G) or GluA2 (K) per PSD95 puncta between the control and the TTX-treated conditions (n = 534 and 454 synapses for control and TTX dataset, respectively, p < 10−6 for GluA1 and p < 10−3 for GluA2, respectively, KS test). L, O, A random sample of 400 intensity values were chosen, rank ordered and plotted to provide a scaling equation for GluA1 (L; y = 1.56x – 6890) and GluA2 (O; y = 1.22x − 1190). M, P, Using the slope of the equation as a reference, the TTX dataset was scaled using multiple values and compared with the control. The scaling factor providing the maximum p value between the scaled-TTX and control dataset was chosen as the multiplicative scaling factor for GluA1 (1.28, p = 0.006, KS test; M) and GluA2 (1.16, p = 0.80, KS test; P). N, Q, Cumulative frequency distribution between control, TTX, and scaled-TTX for GluA1 (N) and GluA2 (Q) showed no significant difference between the control and scaled-TTX distributions.

