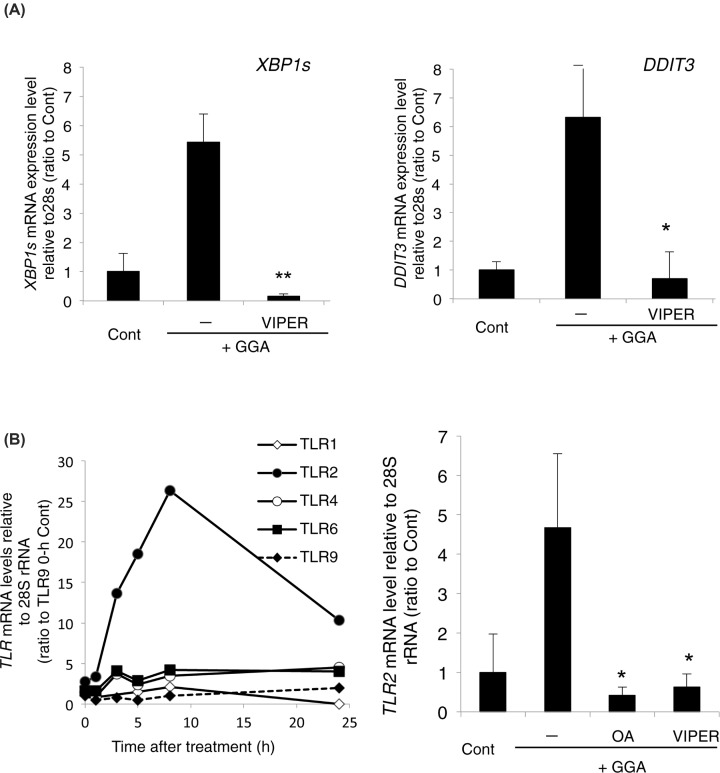
Figure 2. GGA-mediated TLR4 signalling induces UPRs.
(A) Levels of XBP1s (left panel) and DDIT3 mRNA (right panel) were measured by RT-qPCR at 5 h after 20 μM GGA treatment in the absence (−) or presence of 5 μM VIPER. Values are the means ± SD (n=3). Control cells were treated with the ethanol vehicle alone. * and ** indicate statistical significance (P<0.05 and P<0.01, respectively) compared with GGA alone as determined by the Student’s t test. (B) Left panel: total RNA was extracted to measure the levels of TLR1, 2, 4, 6, and 9 mRNAs by RT-qPCR at the indicated time points after treatment with 20 µM GGA; Right panel: HuH-7 cells were treated with 20 µM GGA for 5 h in the absence (−) or presence of 50 µM oleic acid (OA) or 5 µM VIPER. Control cells were treated with the vehicle alone. Values are the means ± SD (n=3). * indicates statistical significance (P<0.05) compared with GGA alone as determined by the Student’s t test.

