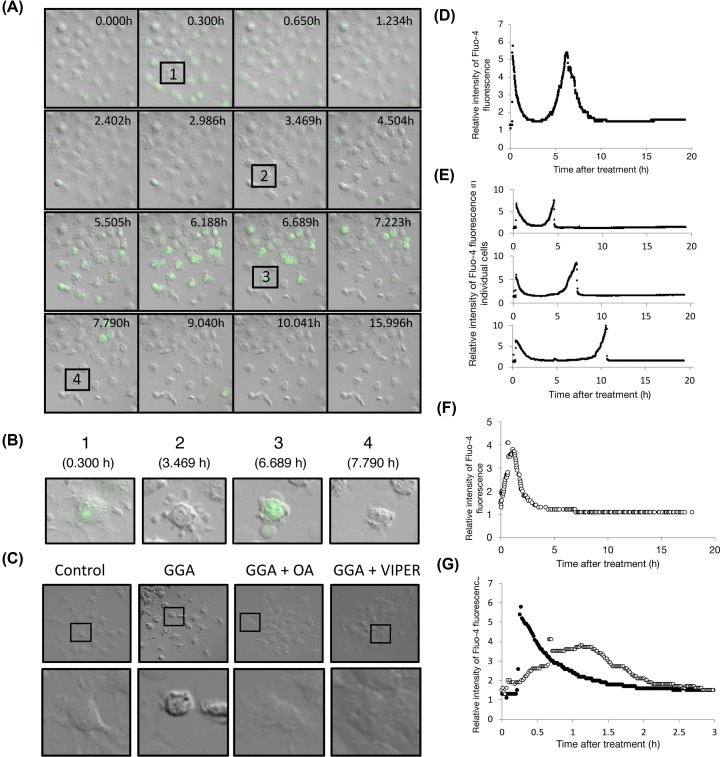
Figure 7. Time-series of live cell images of Fluo-4 AM-loaded HuH-7 cells after GGA treatment.
(A,B) Immediately after treatment with 10 µM GGA, live cell imaging was performed with the green fluorescence of Fluo-4 AM in HuH-7 cells cultured in a chamber unit of a LSM700 confocal laser-scanning fluorescence microscope. Snap shots at each time point shown in each frame were time-dependently arrayed from 0 to 16 h. Rectangles numbered 1–4 containing the same cell are enlarged and shown in (B). (C) Live cell imaging was performed after 16 h of treatment with ethanol (Cont), 10 µM GGA (GGA), 10 µM GGA plus 50 µM oleic acid (GGA+OA), or 10 µM GGA plus 5 µM VIPER (GGA+VIPER). Each square in each upper panel is enlarged and shown in the lower panel. (D,E) Total fluorescence intensity was monitored in each microscopic field (D) or each cell (E) and plotted up to 18 h every minute after GGA addition. (F,G) Total fluorescence intensity was monitored in each microscopic field and plotted up to 16 h every minute after GGA addition with Ca2+-free medium (F). Early changes in the fluorescence intensity of cells cultured in Ca2+-free medium (open circle) are shown from 0 to 3 h compared with HuH-7 cells (closed circle) cultured in DMEM containing Ca2+ (G).

