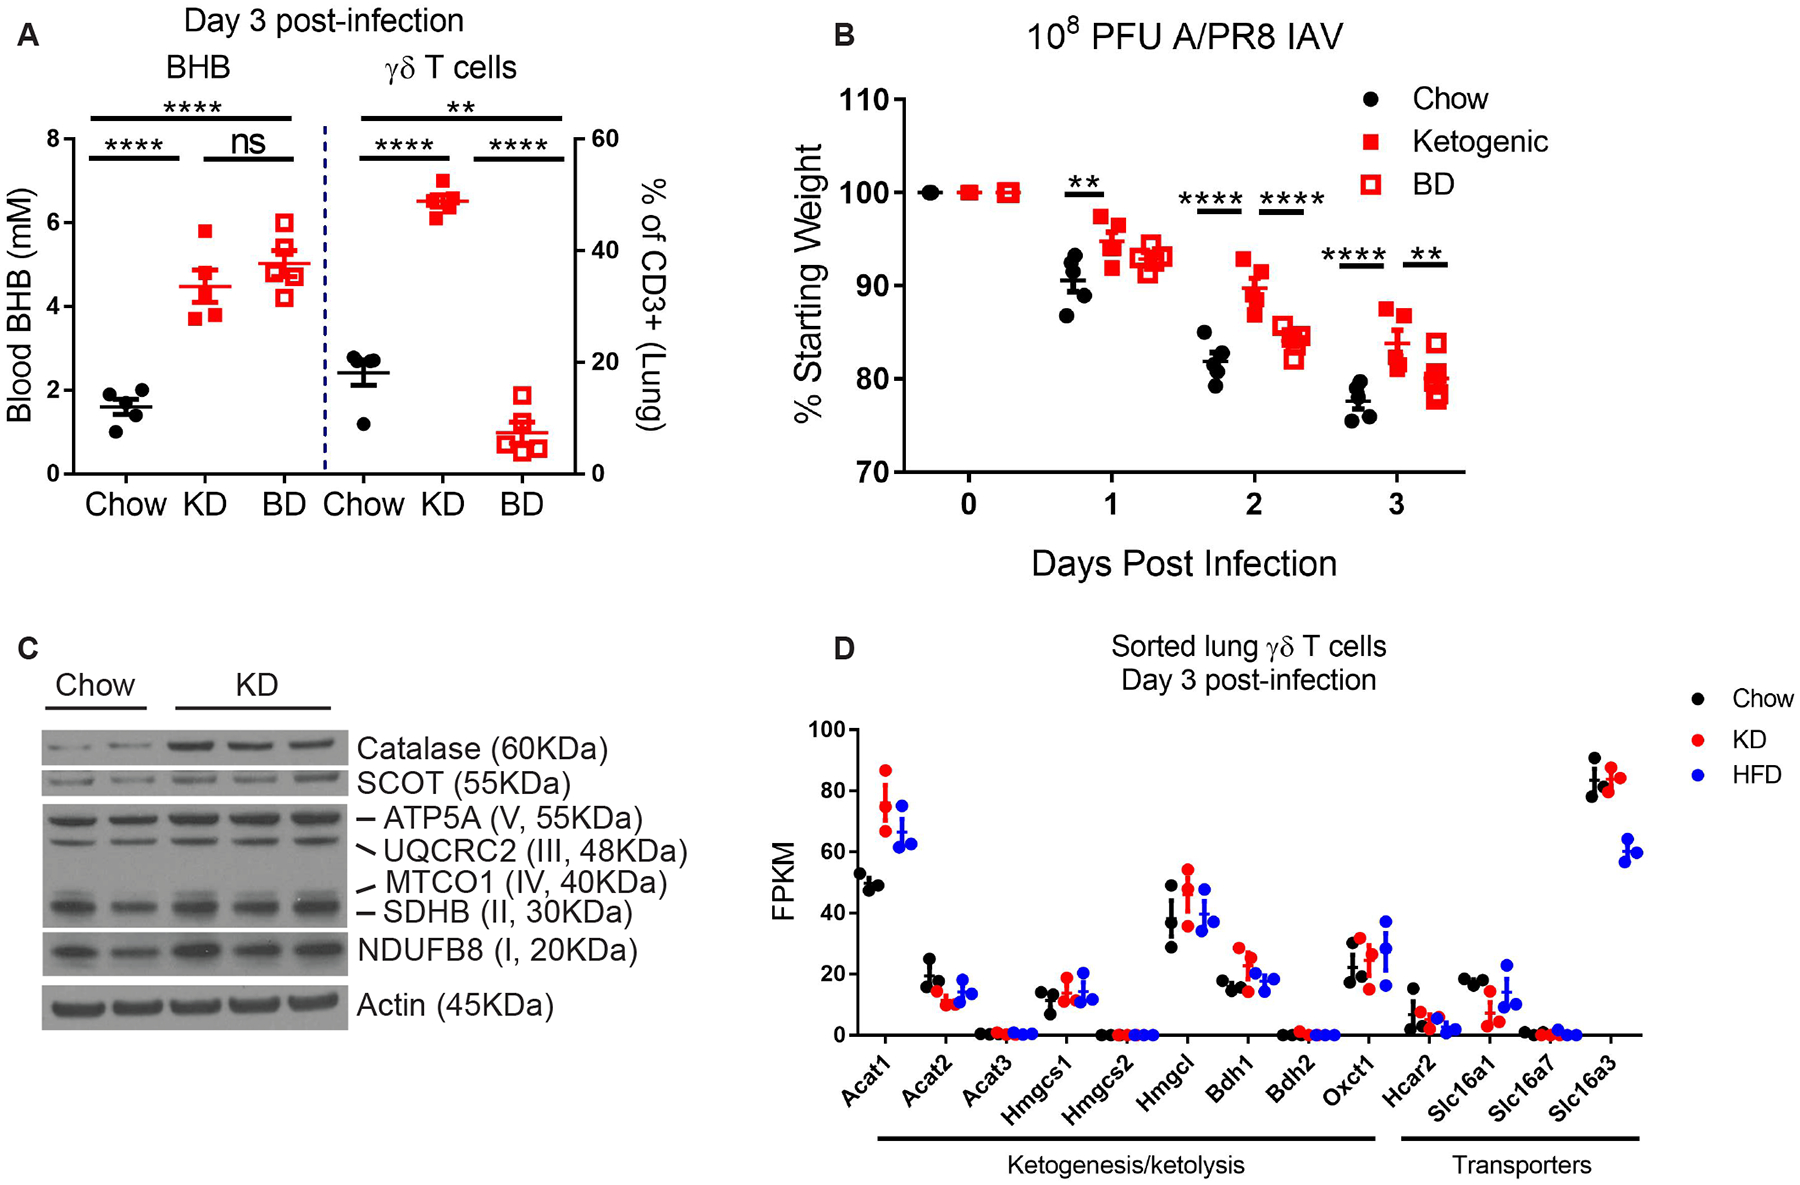
Figure 3. Protective γδ T cell expansion requires metabolic adaptation to KD.

(A) Blood BHB and lung γδ T cells on day 3 post-IAV in mice fed chow (n=5) vs. KD (n=5) vs. 1,3-Butanediol (BD, n=5) beginning 1 week prior to infection. Statistical differences were calculated by 1-way ANOVA with Tukey’s correction for multiple comparisons (B) Body weights of IAV-infected mice fed chow (n=5), KD (n=5), or BD (n=5). Statistical differences were calculated by paired 2-way ANOVA with Tukey’s correction for multiple comparisons. (A-B) Data are representative of at least 2 independent repeats. (C) Western blot of mitochondrial oxidative metabolism proteins in whole lung tissue 3 days after IAV infection in chow and KD-fed mice. Each lane represents an individual mouse. (D) RNAseq expression data of ketone metabolism genes from sorted γδ T cells 3 days post-infection. For all graphs, each symbol represents an individual mouse. Data are expressed as mean±SEM. **p<0.01, ****p<0.0001.
