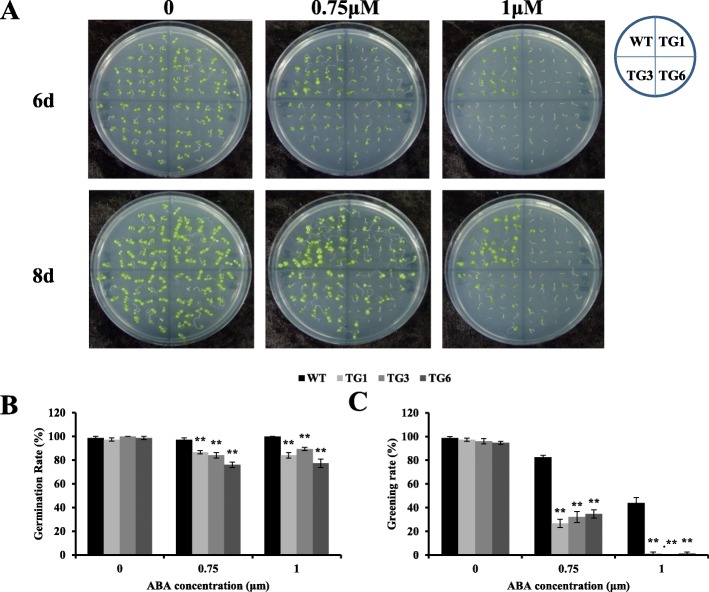
Fig. 6.
Germination and greening rates of wild type (WT) and transgenic (TG1, TG3 and TG6) plants in response to abscisic acid (ABA). a, seed germination of WT and AsHSP26.8a TG plants subjected to 0, 0.75 and 1 μM of ABA 6 and 8 d after treatment. b, germination percentages of WT and TG seeds subjected to 0, 0.75 and 1 μM of ABA 6 d after treatment (n = 3). C, greening percentages of WT and TG seeds (percentages of seeds with fully expanded cotyledons) subjected to 0, 0.75 and 1 μM of ABA 6 d after treatment (n = 3). Each column represents mean of three biological replicates. Error bars represent SE. ‘*’ or ‘**’ indicate significant differences between TG and WT plants at P < 0.05 or 0.01 respectively by Student’s t test. The layout of the plates is shown on the upper right-hand corner

