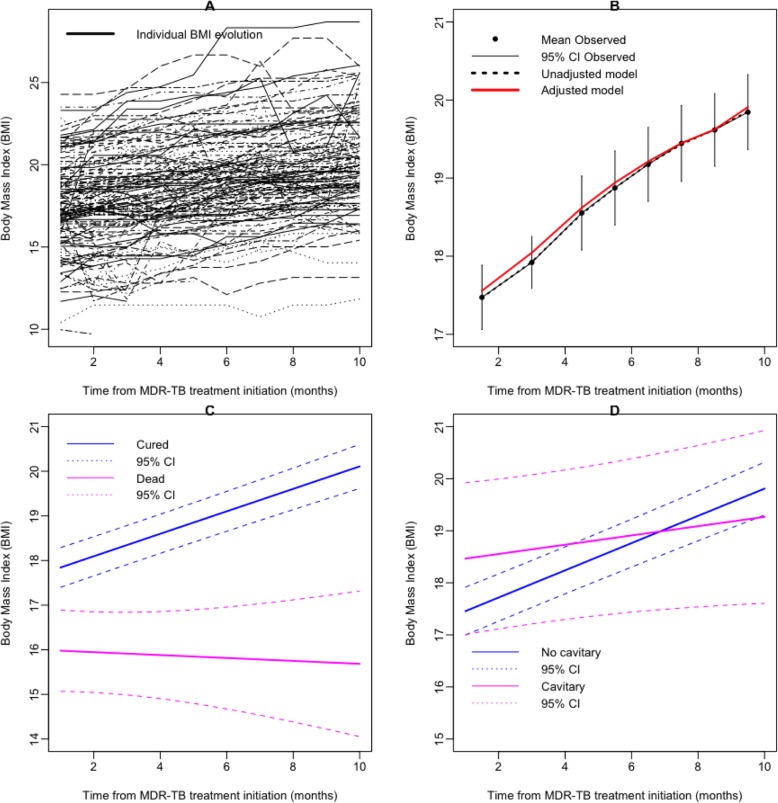
Fig. 2.
a Individual MDR-TB patients’ evolution in body mass index (BMI) (black lines), b mean increase in BMI (black dots) and 95% CI (black line), unadjusted prediction from linear mixed model (LMM) (dashed line) and adjusted for treatment outcome and lung cavities on X-ray prediction from LMM (red line); c Prediction of BMI progression according to the MDR-TB treatment outcome (solid lines): cured (blue line), dead (magenta line), dashed lines were the 95% CI of the prediction from LMM; d Prediction of BMI progression according to the lung cavities on X-ray (solid lines): absence of lung cavities (blue line), presence of lung cavities (magenta line), dashed lines were the 95% CI of the prediction from LMM

