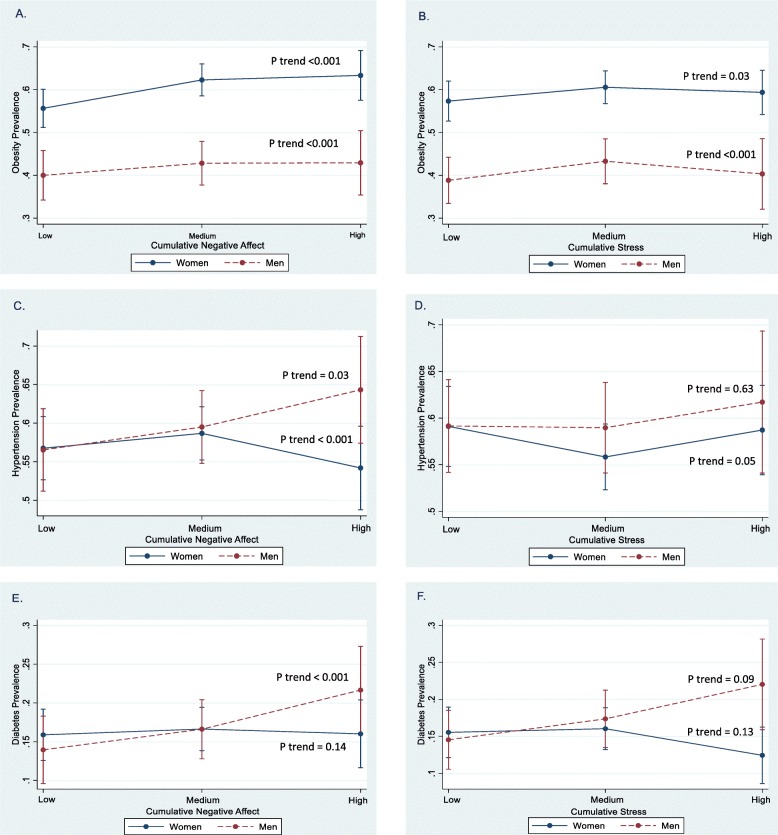
Fig. 1.
Predicted associations of obesity prevalence (a and b), hypertension prevalence (c and d) and diabetes prevalence (e and f) with levels of cumulative negative affect and cumulative stress by sex with 95% confidence intervals-CIs, JHS 2000–2004. Notes: Fully adjusted models of the association of predicted prevalence ratios (PR, 95% CI) of obesity, hypertension, and diabetes at baseline with low, medium, and high cumulative negative affect and cumulative stress by sex. All predicted models are adjusted for age, education, income, smoking, physical activity, fat in diet, alcohol consumption, and body mass index (except in the obesity analysis). P for trend represents the linear trend across categories of cumulative negative affect and cumulative stress stratified by women and men

