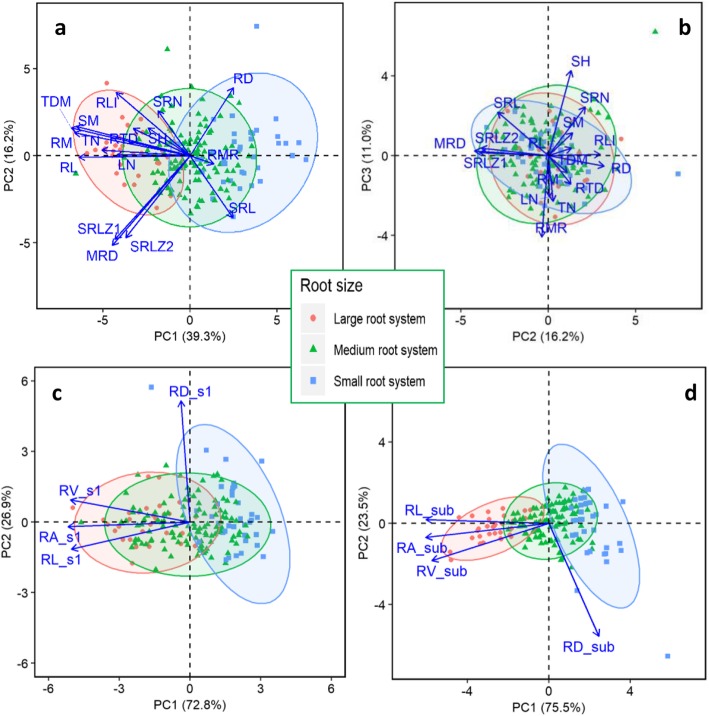
Fig. 6.
Principal component analysis of (a, b) 16 selected global traits (12 root-related and four shoot traits) and (c) four root traits in the top section (0–20 cm) and (d) sub-section (below 20 cm) with genotypes presented by root system size, among 184 wheat genotypes grown in a semi-hydroponic phenotyping platform 35 days after transplanting. The position of each global trait is shown for (a) PC1 vs. PC2 representing 55.5% of the variability, and (b) PC2 vs. PC3 representing 27.2% of the variability. The position of each (c) top section trait and (b) sub-section trait for PC1 vs. PC2 representing 100% of the variability, respectively

