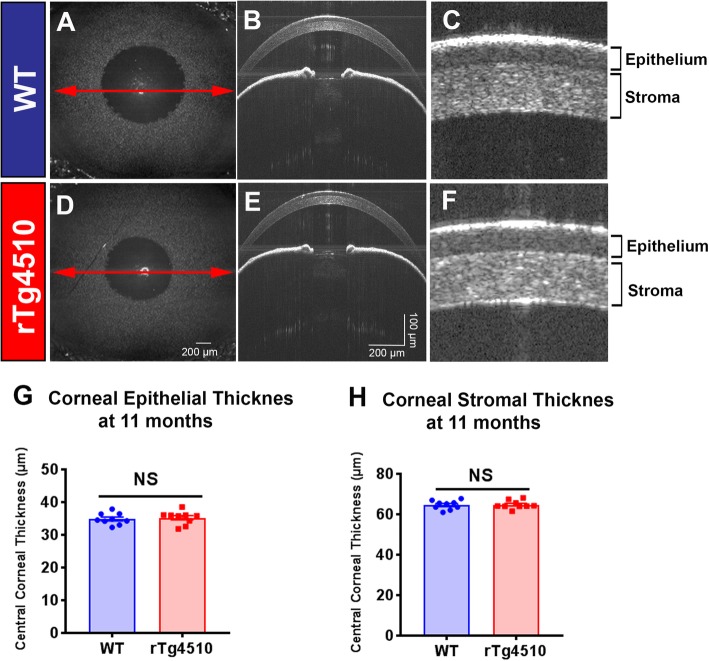
Fig. 1.
Spectral domain optical coherence tomography (SD-OCT) images of the anterior segment from wild type mice and rTg4510 mice aged 11 months. aEn face view of the WT mouse eye (3 mm × 3 mm rectangular scan) and b corresponding SD-OCT scan of the anterior segment. Red arrowed line represents the en face location of the scan. c, f Structure of the corneal epithelium and stroma, as shown using SD-OCT. No visible differences in the corneal structure or anterior segment were observed between WT (a-c) and rTg4510 mice (d-f). g, h There were no quantitative differences in corneal epithelial (g) or stromal thickness (h) between WT and rTg4510 mice. Data are shown as mean ± SEM where NS represents a comparison that is not statistically significant (n = 8 per group) as assessed using unpaired Student's t-test. Scale bars represent 200 μm in Fig. 1a and d, and 100 μm (vertical axis), and 200 μm (horizontal axis) in Fig. 1b and e

