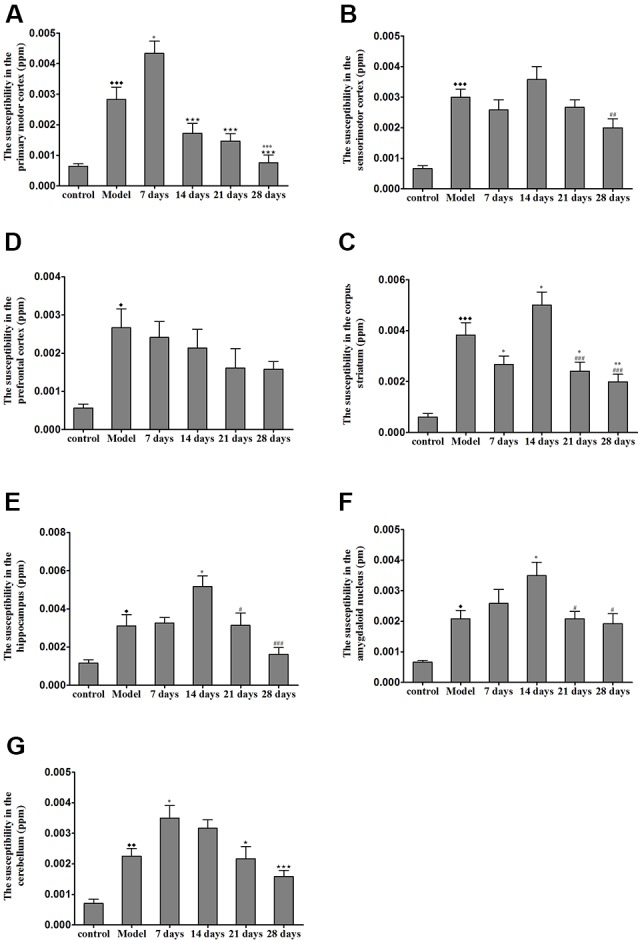
Figure 5.

Susceptibility values in various regions of TX mice brain after PCA treatment. (A) The magnetic susceptibility in the primary motor cortex of the TX mice was increased as compared with that in the primary motor cortex of mice in the control group. The magnetic susceptibility increased in the primary motor cortex after 7 days of treatment with PCA and decreased on 14, 21, 28 days of PCA treatment. (B) The magnetic susceptibility in the sensorimotor cortex of the TX mice was significantly increased as compared with that in the sensorimotor cortex of mice in the control group. (C) The magnetic susceptibility of the TX mice in the prefrontal cortex was increased as compared with that of mice in the control group. (D–F) The magnetic susceptibility of the TX mice in the corpus striatum, hippocampus, and amygdaloid nucleus, respectively, was increased as compared with that of mice in the control group. The magnetic susceptibility in the corpus striatum, hippocampus, and amygdaloid nucleus of TX mice increased on the 14th day and decreased on the 21st and 28th days. (G) The magnetic susceptibility in the cerebellum of TX mice was increased as compared with that in the cerebellum of mice in the control group. The magnetic susceptibility in the cerebellum of TX mice increased on the 7th day and decreased on the 21st and 28th days. Data are presented as the mean ± SEM; n = 6 animals/group; one-way ANOVA, and Bonferroni’s post hoc test, ⧫P < 0.05, ⧫⧫P < 0.01, ⧫⧫⧫P < 0.001 vs. the corresponding control group; *P < 0.05, **P < 0.01, ***P < 0.001 vs. the corresponding model group; ⋆P < 0.05, ⋆⋆⋆P < 0.001 vs. the corresponding 7th day group; #P < 0.05, ##P < 0.01, ###P < 0.001 vs. the corresponding 14th day group.
