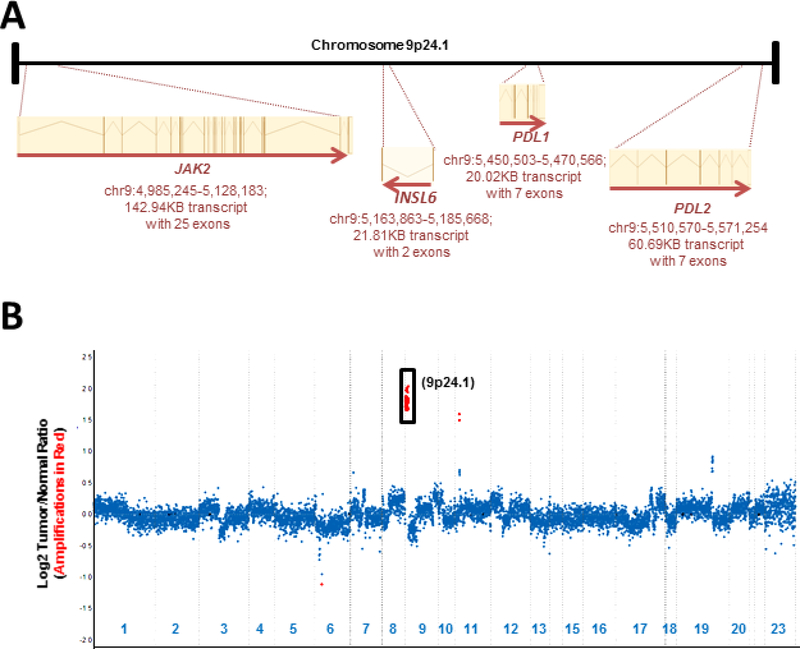
Figure 1: Copy Number Assessment (Case 1).
A schematic representation of genes present at the 9p24.1 locus is shown ((a) not to scale). A copy number plot for a sarcomatoid renal cell carcinoma profiled using MSK-IMPACT has been depicted (b). Relative (Log2) tumor/normal ratios (y-axis) and corresponding chromosomes (x-axis) are displayed, with each blue dot representing an individual probe region. Amplified regions are shown in red and show a 3.5-fold amplification for JAK2/PD-L1 and PD-L2 at 9p24.1. MSK-IMPACT, Memorial Sloan Kettering Cancer Center Integrated Mutation Profiling of Actionable Cancer Targets.

