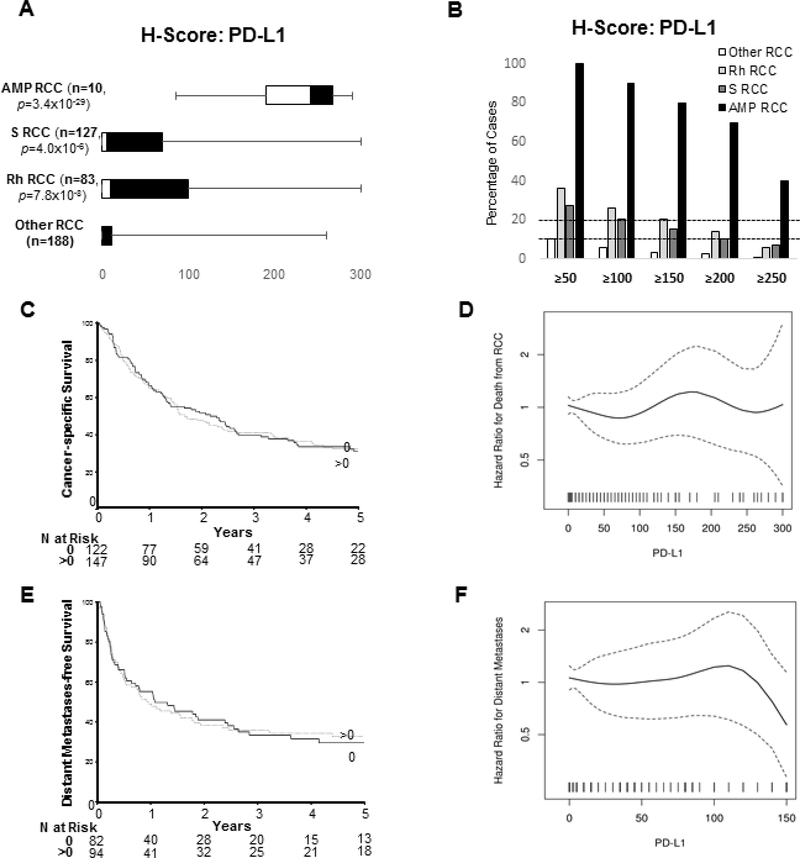
Figure 4: PD-L1 Expression Status of High-Grade Renal Cell Carcinomas: Prognostic Significance.
H-scores for PD-L1 expression based on immunohistochemistry was calculated semi quantitatively as the product of intensity of staining (graded from 0 to 3) and the percentage of positive cells showing membranous staining (0 to 100%) for 398 renal cell carcinomas. The range of distribution of H-Scores show significantly higher expression for 9p24.1 amplified renal tumors compared to cases without this genomic signature (a). The percentage of indicated sub-categories of renal tumors that have a H-Score ≥50, ≥100, ≥150, ≥200 and ≥250 is shown (b). Univariable associations of categorized (c) and continuous (d) PD-L1 H-scores with cancer-specific survival are depicted. In addition, univariable associations of categorized (e) and continuous (f) PD-L1 H-scores with distant metastasis-free survival are depicted. S RCC: sarcomatoid renal cell carcinoma; Rh RCC: renal cell carcinoma with rhabdoid features; Amp RCC: 9p24.1 amplified renal cell carcinoma.

