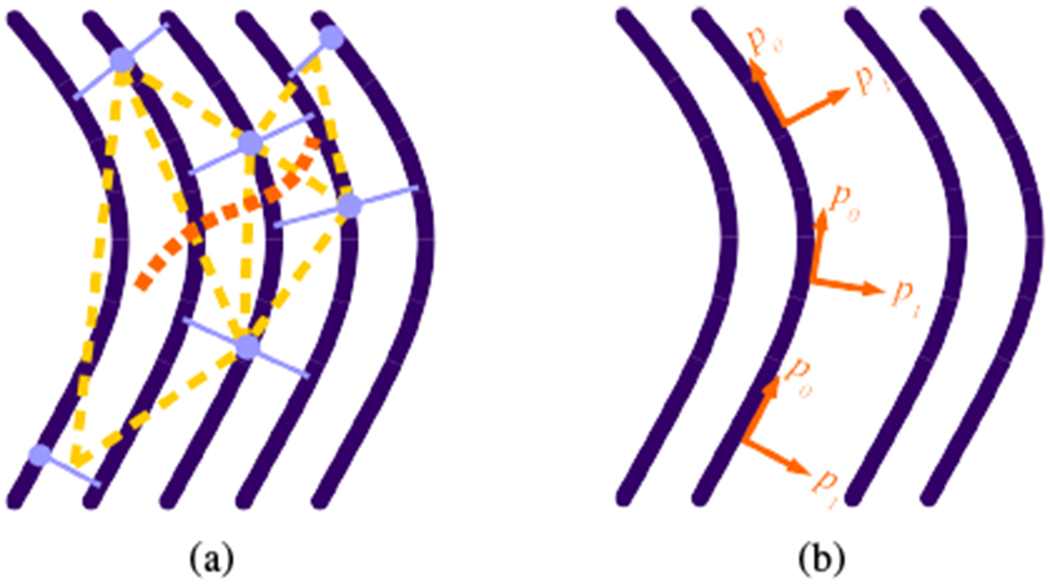
Fig. 3.

(a) Triangulation schematic. Dark purple solid curved lines are fibers; light purple solid straight lines are local correspondence sets; circles indicate the seed point for the set; light orange broken straight lines highlight a possible triangulation between the sets; the dark orange broken curved line follows a path through the triplets of sets to ensure a consistent tract-global parametrization. (b) Schematic of the local orientation of the direction of changing parametrization along a tract. While p0 varies along the path of the fiber, p1 only varies between fibers.
