
Fig. 7.
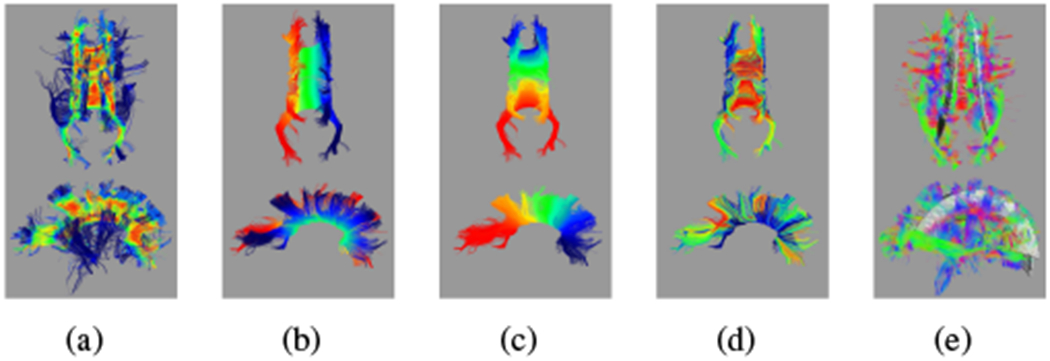
For the same ≈ 32 weeks GA subject from Fig. 2: (a) vertex scores [Eq. (3)]; red is a high score, blue is a low score. Middle panels show the refined tract with (b) p0, (c) p1, and (d) p2. Colors show the value of the parametrization from red at one extreme to blue at the other. (e) Including all fibers that pass through voxels associated with the refined tract introduces connectivity not associated with the CC. Colors indicate the primary direction of diffusion.