Fig. 8.

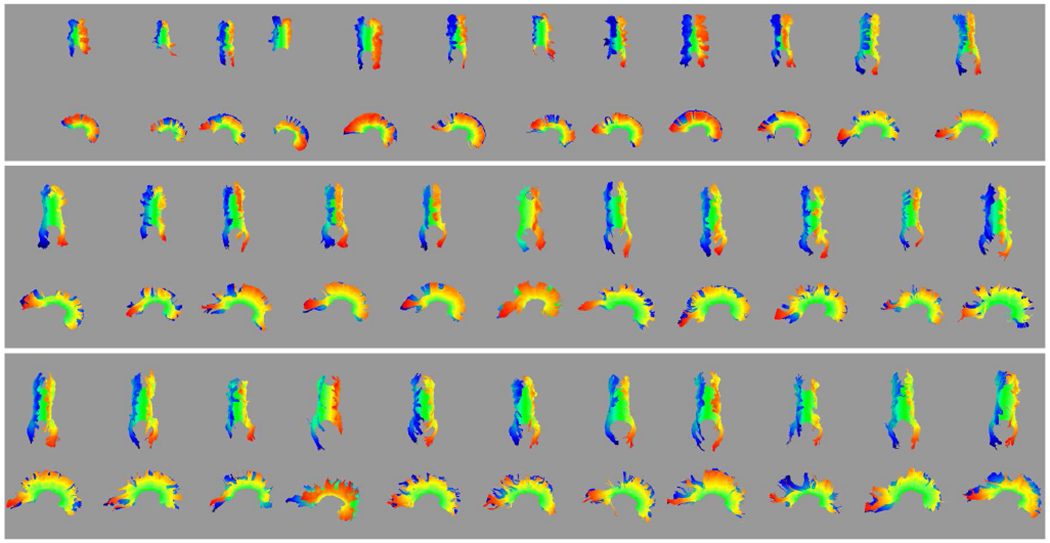
Automated reconstruction of the CC for individual subjects, ordered by age (youngest ≈ 20 weeks GA in the upper left to oldest ≈ 36 weeks GA in the lower right). Colors indicate the value of p0 from red at one extreme to blue at the other.

Automated reconstruction of the CC for individual subjects, ordered by age (youngest ≈ 20 weeks GA in the upper left to oldest ≈ 36 weeks GA in the lower right). Colors indicate the value of p0 from red at one extreme to blue at the other.