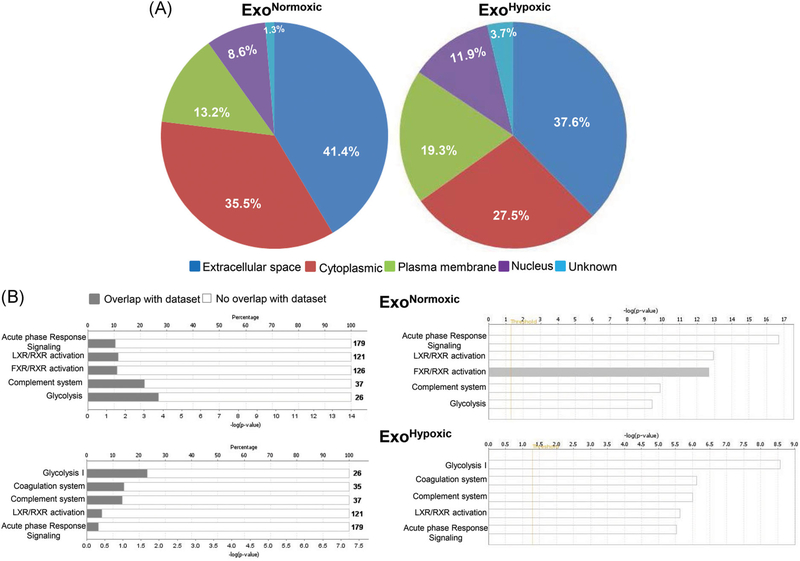
FIGURE 5.
Characterization of proteins loaded in ExoNormoxic and ExoHypoxic by mass spectrometry. Proteomic profiling of ExoNormoxic and ExoHypoxic was performed by LC/MS/MS and data analyzed by IPA software. A, Cellular localization of proteins loaded in ExoNormoxic and ExoHypoxic are presented in pi diagrams. B, Top five canonical pathways in ExoNormoxic and ExoHypoxic are shown. In each case, percentage overlap with the dataset (left panel) as well as –log (P value; right panel) are presented. ExoHypoxic, exosomes secreted under hypoxic condition; ExoNormoxic, Exosomes secreted under normoxic condition; IPA, ingenuity pathway analysis; LC/MS/MS, liquid chromatography/mass spectrometry [Color figure can be viewed at wileyonlinelibrary.com]

