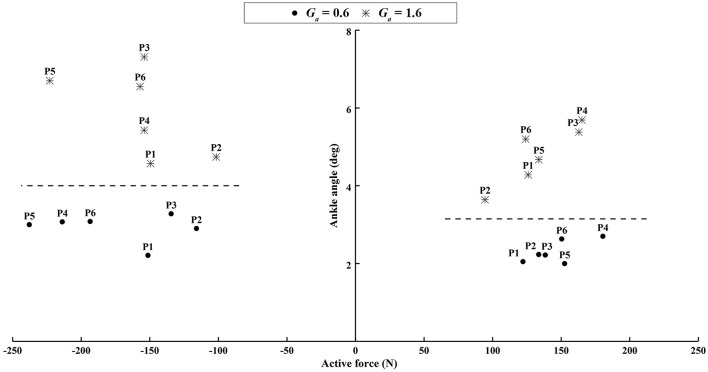
Figure 13.
The difference of the peak ankle angle between the experimental and passive simulated results produced by different active force. The left subplot shows the results when the participants voluntarily pushed down the foot within 60–80% of the gait cycle. The right subplot shows the results when the participants voluntarily lifted up the ankle joint within 30–60% of the gait cycle.

