Figure 10.
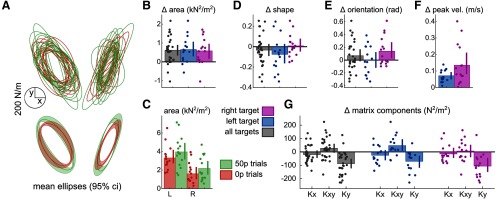
Reward increases stiffness at the end of movement. A, Individual (top) and mean (down) stiffness ellipses. Shaded areas around the ellipses represent bootstrapped 95% CIs. Right and left ellipses represent individual ellipses for the right and left target, respectively. B, Ellipses area normalized to 0 p trials. Error bars indicate bootstrapped 95% CIs. C, Non-normalized area values are also provided to illustrate the difference in absolute area as a function of target. L, Left target; R, right target. D, Ellipse shapes normalized to 0 p trials. Shapes are defined as the ratio of short to long diameter of the ellipse. E, Ellipse orientation normalized to 0 p trials. Orientation is defined as the angle of the ellipse's long diameter. F, Peak velocity normalized to 0 p trials. Peak velocity increased with reward. G, Stiffness matrix elements for 50 p trials normalized to the stiffness matrix for 0 p trials.

