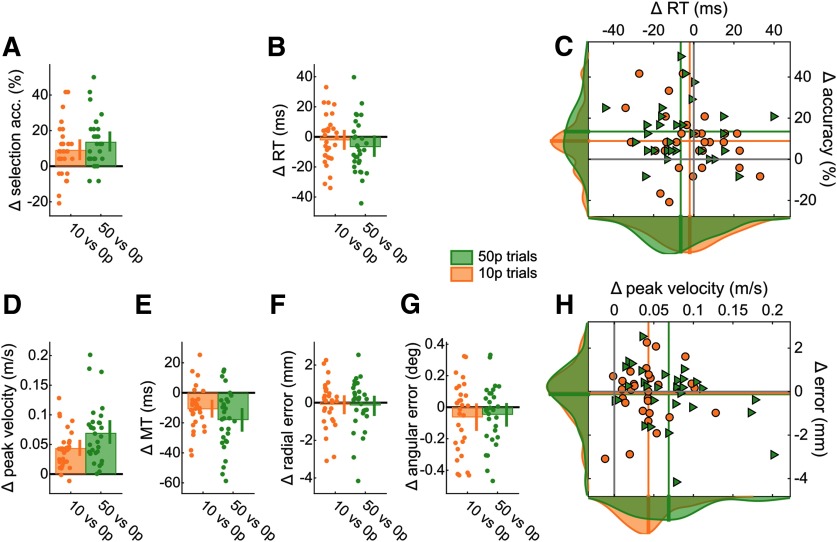
Figure 3.
Reward enhances performance in both selection and execution. For all bar plots, data were normalized to 0 p performance for each individual. Bar height indicates group mean. Dots represent individual values. Error bars indicate bootstrapped 95% CIs of the mean. A, Selection accuracy, as the percentage of trials where participants initiated reaches toward the correct target instead of the distractor target. B, Mean reaction times. C, Scatterplot of mean reaction time against selection accuracy. Values are normalized to 0 p trials. Colored lines indicate the mean value for each condition. Solid gray lines indicate the origin (i.e., 0 p performance). Data distributions are displayed on the sides, with transversal bars indicating the mean of the distribution. Triangles represent 50 p trials. D, Mean peak velocity during reaches. E, Mean movement times of reaches. F, Mean radial error at the end of the reach. G, Mean angular error at the end of the reach. H, Scatterplot showing execution speed (peak velocity) against execution accuracy (radial error), similar to C.

