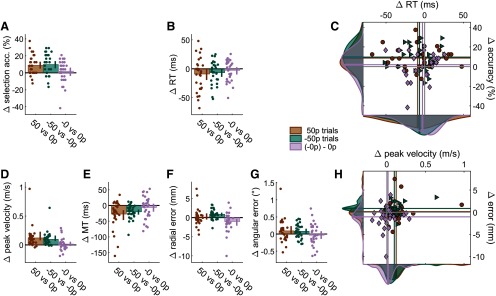
Figure 5.
Reward and punishment have a similar effect on selection, but not on execution. For all bar plots, data were normalized to baseline performance (0 p or −0 p) for each individual. Bar height indicates group mean. Dots represent individual values. Error bars indicate bootstrapped 95% CIs of the mean. A, Selection accuracy. B, Mean reaction times for each participant. C, Scatterplot of mean reaction time against selection accuracy. Values are normalized to 0 p trials. Colored lines indicate mean values for each condition. Solid gray lines indicate the origin (i.e., 0 p performance, or −0 p, in the punishment condition). Data distributions are displayed on the sides, with transversal bars indicating the mean of the distribution. Circles, triangles and rhombi represent 50 p, −50 p and (−0 p), and −0 p trials, respectively. D, Mean peak velocity. E, Movement times. F, For radial error, punishment did not protect against an increase in error, while reward did. However, a difference can be observed between the baselines (blue bar). G, Angular error. H, Scatterplot showing execution speed (peak velocity) against execution accuracy (radial error), similar to C.

