Figure 6.
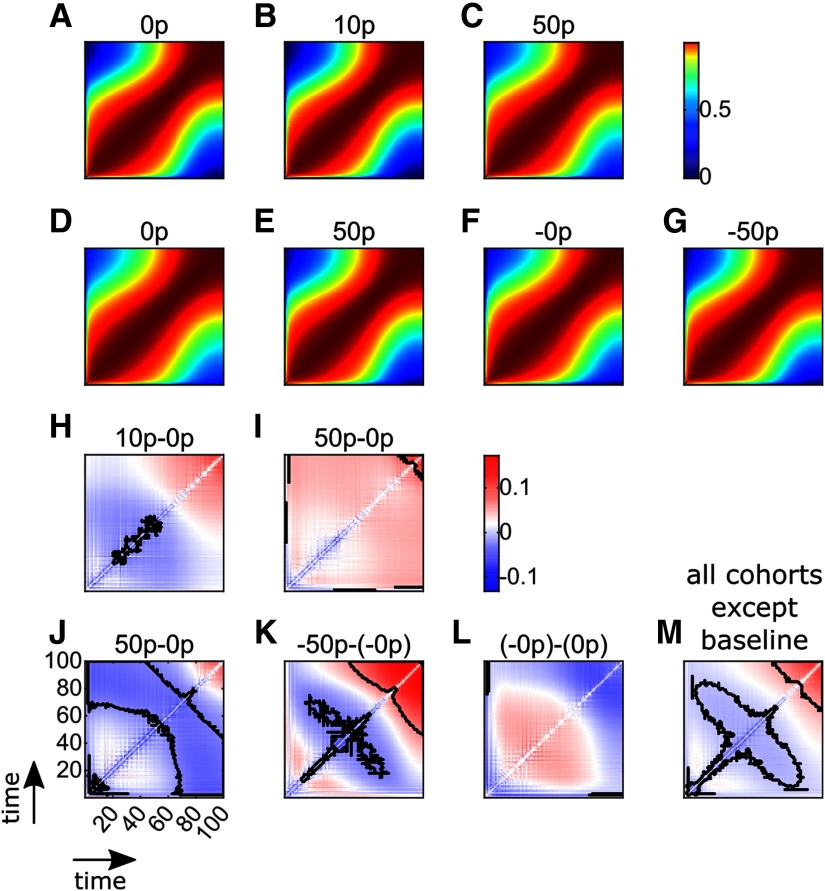
Time-time correlation maps show that monetary reward and punishment have a biphasic effect on the reach time course. A-C, Time-time correlation maps for all trial types (0, 10, and 50 p) in Experiment 1. Colors represent Fisher-transformed Pearson correlation values. For each map, the bottom left and top right corners represent the start and the end of the reaching movement, respectively. The color maps are nonlinear to enhance readability. D-G, Time-time correlation maps for all trial types (0, 50, −0, −50 p) in Experiment 2. H, I, Comparison of Fisher-transformed correlation maps with the respective baseline map (A) for Experiment 1. Solid black line indicates clusters of significance after clusterwise correction for multiple comparisons. J-L, Similar comparisons for Experiment 2, with each condition's respective baseline (D, F). M, Similar comparison when pooling all contrasts, except the baselines contrast together.

